AUD/NZD For Bullishwait for pull-back near by entry point and then go long
general trend is up trend
have fun :)
AUDNZD trade ideas

AUD/NZD: Bearish Setup in Motion !!Price is respecting a key resistance zone and starting to shift structure to the downside. If sellers maintain pressure, a clean move lower is on the table.
🎯 TP: 1.08335
📌 (Not financial advice)
#AUDNZD #ForexTrading #BearishSetup #PriceAction #SmartMoney #TechnicalAnalysis #AussieKiwi #FXSetup

AUD/NZD Forex Ambush: Thief Trading’s Profit-Grabbing Plan!🌟 AUD/NZD Forex Heist: Snag Profits with the Thief Trading Plan! 🚀💰
Hey there, wealth hunters and market bandits! 🤑💸
Welcome to the Thief Trading blueprint for cracking the AUD/NZD "Aussie vs Kiwi" Forex vault! 🏦🔥 This plan fuses sharp technicals 📊 with gritty fundamentals 📈 to score big loot. Follow the charted strategy, leaning into long entries, and aim to cash out near the high-risk Yellow Moving Average Zone 🎯—a hotspot for overbought vibes, consolidation, or trend flips where bearish bandits prowl 🐻. Grab your profits and treat yourself—you’ve earned it! 💪🎉
Entry Signals 🔑:
Bullish Ambush 🚀: Jump in on a pullback to the Blue MA at 1.08600 or Green MA at 1.07600. 📈
Bearish Blitz ⚡: Go short on a break below the Blue MA at 1.08200, riding the downward wave. 📉
Set a chart alert 🔔 to catch the breakout entry in real-time!
Stop Loss Tactics 🛑:
For buy stop orders, wait for the breakout to confirm before setting your stop. 📍 Place it at 1.07800 for Blue MA bullish entries or 1.06800 for Green MA entries on swing trades. Adjust based on your risk, lot size, and number of orders—play smart, not wild! 😎🔥
Profit Targets 🎯:
Bullish Raiders 🏴☠️: Shoot for 1.09700 or bail early if the market shifts.
Bearish Thieves 🕵️: Target 1.07600.
Scalpers 👀: Stick to long-side scalps. Big players can dive in; smaller traders, join the swing crew and execute the heist with a trailing stop loss to guard your gains! 💰🛡️
The AUD/NZD Forex Bank Heist (Day/Swing Trade) is riding a bullish surge 🐂, driven by key fundamentals. 📜 Dig into the COT Report, macroeconomics, sentiment analysis, intermarket trends, and future price targets for the full scoop—check those links! 🔗👉
Trading Alert: News & Position Management 🚨
News drops can shake the market! 📰 To protect your stash:
Avoid new trades during news events. 🚫
Use trailing stops to lock in profits on open positions. 🔒
Support the heist! Hit that Boost Button 🚀 to power up our robbery squad. With the Thief Trading Style, stacking profits daily is a breeze! 🌟 Stay sharp for the next heist—catch you in the markets! 🤑🐱👤🤝.

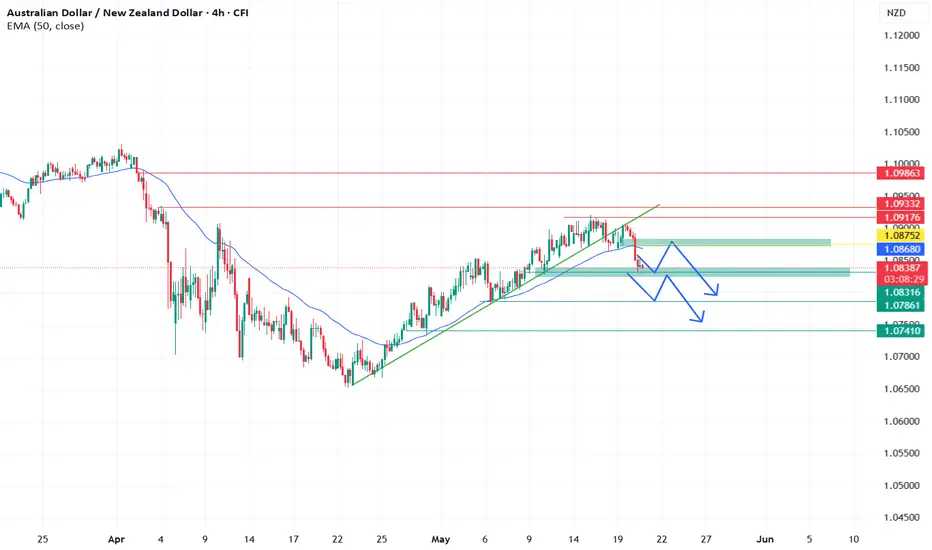
AUDNZD BROKE AND CLOSED BELOW H4 TRENDLINE AND EMA 50AUDNZD has maintained a bearish tone since Monday’s New York session, following a break and retest of the trendline. The pair also closed below the 50 EMA, reinforcing the dominance of sellers in the market. Meanwhile, there are several factors that led to the weakness of the AUD. Earlier on Tuesday, the RBA implemented another interest rate cut, aligning with market expectations. However, the central bank's cautious outlook on economic growth has led to a more dovish tone, potentially limiting the Australian dollar's strength. Which was priced in on the chart.
TECHNICAL VIEW:
From technical perspective, the pair is seen bearish after the break and retest of the 4H trendline and price having closed below EMA 50 confirms that too. Meanwhile price is supported around 1.08316. Technicians ordinarily expects a rebound around 1.08752 before the next throw with potential target around 1.07861 and 1.07410. Whilst retracing, a break above 1.09176 would hint a reversal and hence potentially targeting 1.09332 and 1.09862. Break out of these levels are not ruled out.
UPCOMING CATALYST:
For the remainder of this week, there are no major economic releases scheduled. However, on Friday, May 23, 2025, Statistics New Zealand is set to publish the Q1 2025 Retail Sales data at 10:45 AM NZST (GMT+12).
This release will offer insights into consumer spending patterns and the overall health of New Zealand's economy. Strong retail sales figures could bolster the New Zealand dollar (NZD), while weaker numbers might exert downward pressure.
NZDAUD 4H Long 🧠 NZDAUD 4H Long Trade Setup (Smart Money Concept)
Pair: NZDAUD (New Zealand Dollar / Australian Dollar)
Timeframe: 4H
Entry: 0.91751
Stop Loss (SL): 0.91516
Take Profit (TP): 0.92465
Risk-Reward Ratio (R:R): 1 : 2.9
📊 Technical Rationale
CHoCH (Change of Character) indicated a potential trend reversal.
Multiple Breaks of Structure (BOS) confirmed a shift in order flow from bearish to bullish.
Price broke out of the descending trendline, indicating a weakening bearish grip.
Entry was taken after a clear demand zone tap and confirmation from minor structure BOS.
Target set near previous supply imbalance (0.92465).
SL placed just below the demand zone (0.91516) to protect against fake-outs.
📸 Post Caption (Instagram / TradingView / Telegram)
🚀 NZDAUD 4H Long Trade | Clean SMC Play
Caught a long after price flipped structure with a CHoCH + BOS combo. Demand zone held strong and price followed through after descending trendline break.
🔹 Entry: 0.91751
🔹 SL: 0.91516
🔹 TP: 0.92465
🔹 R:R = 1 : 2.9
📚 Confluences:
BOS + CHoCH ✅
Demand Zone Tap ✅
Substructure Break ✅
Trendline Breakout ✅
⚠️ Disclaimer
This content is for educational and informational purposes only and should not be considered financial advice. All trading involves risk. Please do your own analysis before making any trading decisions. I am not a licensed financial advisor.

AUD/NZD SENDS CLEAR BEARISH SIGNALS|SHORT
AUD/NZD SIGNAL
Trade Direction: short
Entry Level: 1.084
Target Level: 1.062
Stop Loss: 1.098
RISK PROFILE
Risk level: medium
Suggested risk: 1%
Timeframe: 1D
Disclosure: I am part of Trade Nation's Influencer program and receive a monthly fee for using their TradingView charts in my analysis.
✅LIKE AND COMMENT MY IDEAS✅

RBA Cuts Rates. AUD DeclinesRBA Cuts Rates. AUD Declines
Today, the Reserve Bank of Australia (RBA) decided to cut the interest rate from 4.10% to 3.85%, continuing its easing policy after a previous cut from 4.35% in February.
According to Reuters, the RBA today cited:
→ progress made in bringing inflation under control;
→ economic risks linked to the ongoing global trade war.
Although the RBA’s decision was widely expected, the Australian dollar weakened noticeably against other currencies — including the New Zealand dollar. The AUD/NZD rate fell to its lowest level in nearly two weeks.
Technical Analysis of the AUD/NZD Chart
From a technical perspective, a bearish breakout occurred:
→ below the lower boundary of the upward trend channel that began in April;
→ and below the 1.087 level, which had served as support in mid-May.
It is possible that:
→ the decline may slow around the 1.083 support zone, where strong demand was evident in the long lower wicks of the 9 May candles (marked with an arrow);
→ the 1.0870–1.0880 area will act as resistance going forward, potentially leading to a retest of the bearish breakout zone on the AUD/NZD chart.
As the market continues to price in the RBA’s decision, attention will turn to the Reserve Bank of New Zealand meeting on 28 May, where a similar rate cut could be on the table.
This article represents the opinion of the Companies operating under the FXOpen brand only. It is not to be construed as an offer, solicitation, or recommendation with respect to products and services provided by the Companies operating under the FXOpen brand, nor is it to be considered financial advice.

AUDNZD 19/05/2025Weekly:
-Bearish W pattern.
-Strong weekly resistance.
-Expecting at least a bearish reaction.
Daily:
-H&S pattern.
-IC.
4H:
-Bearish W pattern.
-H&S pattern.


AUDNZD buy idea-liquiduty below has been taken
-inducement already done
-new high already took place
-mss created

Break & Retest of Key LevelPrice is retesting a major resistance level.
Price has formed a head & shoulders in the H1.
Price broke a rising trendline and retested it.

Long tradeClear move along the trend line, has gone down to take the FVG before heading back up. It will head up to resistance where it has hit multiple times.

AUDNZD: Growth & Bullish Continuation
The charts are full of distraction, disturbance and are a graveyard of fear and greed which shall not cloud our judgement on the current state of affairs in the AUDNZD pair price action which suggests a high likelihood of a coming move up.
Disclosure: I am part of Trade Nation's Influencer program and receive a monthly fee for using their TradingView charts in my analysis.
❤️ Please, support our work with like & comment! ❤️

AUD/NZD For Bearish as pull-backwait for pull-back near by entry point and then go short
general trend is up trend
current phase is pull-back
have fun :)

AUDNZDRSI indicates Bullish Divergence. Trendline Break: A break above a significant downtrend line signals a shift in market sentiment from bearish to bullish. This is a key technical signal that buyers are starting to gain control.

AUD_NZD STRONG RESISTANCE AEHAD|SHORT|
✅AUD_NZD is going up now
But a strong resistance level is ahead around 1.0940
Thus I am expecting a pullback
And a move down towards the target of 1.0880
SHORT🔥
✅Like and subscribe to never miss a new idea!✅
Disclosure: I am part of Trade Nation's Influencer program and receive a monthly fee for using their TradingView charts in my analysis.

AUDNZD Ready to sellwe have down trend on 4H TF and the pair reaches the key level on 1H TF
giving a signal to sell
we will sell from market price
sell @ 1.0875
stoploss @ 1.0915 -40 pip
target @ 1.0675
with 1 : 5 RR

AUD-NZD Correction Ahead! Sell!
Hello,Traders!
AUD-NZD is growing strongly
And the pair looks locally
Overbought so after it
Hits the horizontal resistance
Area around 1.0934 we will
Be expecting a local bearish
Correction and a move down
Sell!
Comment and subscribe to help us grow!
Check out other forecasts below too!
Disclosure: I am part of Trade Nation's Influencer program and receive a monthly fee for using their TradingView charts in my analysis.

AUDNZD possible short, patience required The daily candle has not yet closed but we could have an inside bar setup later today.
Price is below the 200dma and the price action today seems indicative of a bearish breakout that could happen tomorrow.
I am not advising jumping the gun, instead wait and see how it all plays out.
This is not a trade recommendation; it’s merely my own analysis. Trading carries a high level of risk, carefully manage your capital and risk. If you like my idea, please give a “boost” and follow me to get even more.
It’s not whether you are right or wrong, but how much money you make when you are right and how much you lose when you are wrong – George Soros

AUDNZD H12 IdeaPotential for a bullish pullback on the AUDNZD H8 which could lead to a price movement towards the resistance level at 1.09000. BUY levels from 1.08300

AUDNZD Bulls Eyeing a Recovery from Key Support Zone
📉 After a sharp fall, AUDNZD has tapped into a well-defined support zone around 1.07800, forming a possible retracement setup.
📊 Technical Insight:
- Price reacted strongly from the support zone, hinting at buyer interest.
- RSI on the 1H chart is rebounding from the oversold area , suggesting potential bullish momentum.
- Expected retracement target: 1.08245 , a previous resistance level.
📰 Fundamental Boost:
- AUD remains resilient despite global risk sentiment due to improving commodity prices, especially in iron ore — a key Australian export.
On the NZD side, recent RBNZ dovish commentary has slightly weighed on the Kiwi, adding a supportive tone for AUDNZD upside.
📌 Invalidation:
If price breaks and closes below the 1.07800 support zone, this setup becomes invalid.

AUD VS NZYA Bearish trend in the AUD vs NZY currency, taking my trade after having technical analcis of the chart

AUDNZD: Bulls Will Push
The charts are full of distraction, disturbance and are a graveyard of fear and greed which shall not cloud our judgement on the current state of affairs in the AUDNZD pair price action which suggests a high likelihood of a coming move up.
Disclosure: I am part of Trade Nation's Influencer program and receive a monthly fee for using their TradingView charts in my analysis.
❤️ Please, support our work with like & comment! ❤️
