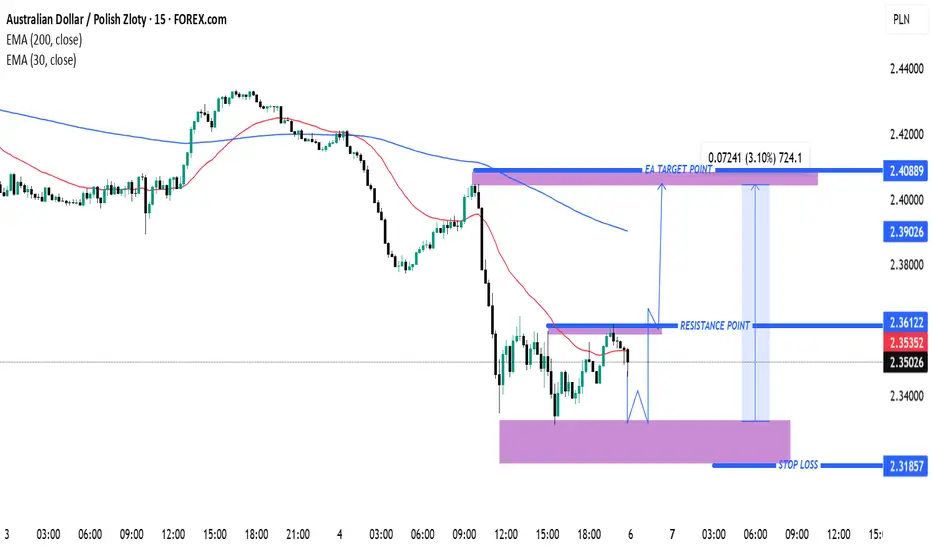
AUD/PLN Bullish Reversal Setup – Buy from Demand Zone Toward 200EMA 30 (Red): 2.35352
EMA 200 (Blue): 2.39026
🧠 Trade Setup: Potential Long Opportunity
📍 Current Price: 2.35026
📌 Key Levels:
Entry Zone (Demand Zone): Around 2.31857 – 2.34500
Strong historical support (highlighted in purple).
Market is expected to pull back here before bouncing.
Stop Loss: 2.31857
Placed below the demand zone to avoid false breakouts.
Resistance Point (Initial Obstacle): 2.36122
Short-term resistance where price previously rejected.
EA Target Point (Main Take Profit): 2.40889
Aligned with a major resistance + 200 EMA.
Also the top of a prior consolidation zone.
⚖️ Risk-to-Reward Breakdown:
Risk: ~317 pips
Reward: ~724 pips
R:R Ratio: ~2.3:1 — Favorable for intraday-to-short-term swing setups.
🔍 Market Insights:
Price has dropped sharply and is consolidating near a support area.
The 200 EMA overhead is sloping downward — signifying overall bearish pressure, but short-term correction is possible.
A bounce from the demand zone could lead to a bullish retracement.
AUDPLN trade ideas
AUD/PLN Technical Analysis: Potential Reversal from Resistance ZThis is a technical analysis chart of the Australian Dollar (AUD) against the Polish Zloty (PLN) on a 30-minute timeframe from TradingView. Here are the key observations:
1. Resistance Zone (Purple Box at the Top):
The price is approaching a key resistance area around 2.4350 - 2.4450.
This zone has previously acted as resistance, suggesting a potential price reversal.
2. Exponential Moving Averages (EMA):
The 200 EMA (Blue Line) at 2.42878 and the 30 EMA (Red Line) at 2.42619 indicate trend direction.
Price is currently testing the 200 EMA, which can act as a dynamic resistance.
3. Projected Price Action (Blue Path):
The analyst expects the price to reject the resistance zone and move downward.
A possible bearish movement is indicated towards the targ

AUD/PLN Technical Analysis – Reversal Opportunity AUD/PLN Chart Analysis (1H) on TradingView 📊 🔴 Overall Trend: ➡️ The price is following a bearish trend 📉, trading below the 200 EMA (🔵 2.45308) and the 30 EMA (🔴 2.43309). ➡️ The market is showing selling pressure, but the price has reached a key support zone 🟣. 🟣 Support Zone (Possible Reversal) 🔵 Potential Entry: 📍 2.41633 (inside the support zone) 🔵 Stop Loss: ❌ 2.40157 (below support) 🔵 Take Profit: ✅ 2.46072 (near resistance and the 200 EMA) 📈 Movement Projection: 🔹 An upward movement of 1.82% 🚀 (0.04389 points) is expected. 🔹 To confirm the uptrend, the price must break above the 30 EMA 🔴 and the 200 EMA 🔵. 💡 Conclusion: 🔸 The chart suggests a buy strategy in the support zone with a target at the resistance. 🔸 If the price breaks the support, it could continue its decline 🚨.

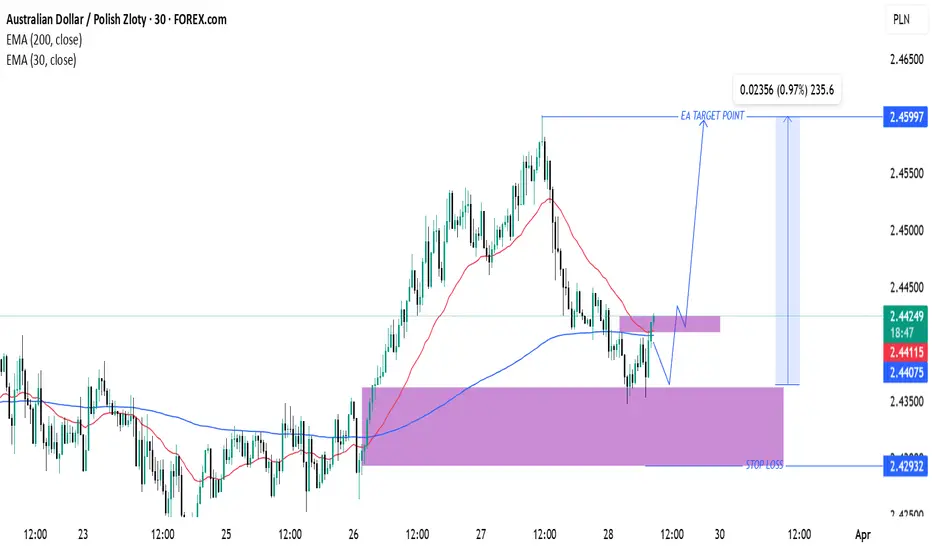
AUD/PLN Trade Setup: Bullish Reversal & Target ProjectionAUD/PLN Technical Analysis & Trade Setup
Chart Overview:
Currency Pair: Australian Dollar (AUD) / Polish Zloty (PLN)
Timeframe: 30-minute chart
Indicators:
200 EMA (Blue): 2.44075
30 EMA (Red): 2.44113
Key Levels & Strategy:
Support & Resistance:
Major Support Zone: Around 2.42932 (Stop Loss Area)
Intermediate Resistance: Near 2.44228
Target Resistance (Take Profit): 2.45997
Trade Projection:
The price recently bounced off the support zone (purple).
A possible retracement and retest of resistance before a strong upward move.
Targeting 0.97% profit potential from 2.44228 to 2.45997.
Entry Strategy:
Confirmation of support hold at 2.44075 - 2.44228.
If price respects this zone, a bullish continuation is expected.
If support fails, price may revisit the stop-loss area (2.42932).
Conclusion:
If price sustains above 2.44113, a bullish move is expected.
Watch for a breakout above resistance for a confirmed long entry.
A drop below 2.42932 would invalidate the setup.
AUDPLN UpdateAUD weakness across the board and this air is primed to move lower. The price is currently rejecting the 50 day moving average after ranging for the entirety of 2021. I expect the pair to try go for the lower range

Short Idea for AUDPLN. Head and Shoulders Top PatternHere we can see that the previous uptrend is in the process of reversing. Price ran up to a key level and then began to lose momentum and consolidate in a distribution, eventually forming a head and shoulders and breaking out to the downside. This presents a very good opportunity to sell again. Wait for price to pull back to the previous support level turned resistance and watch for bearish price action. If we get that formation we can sell the pattern with a stop loss placed above the previous high and target the next support zone.

AUDPLN 4 month #rectangle #ChartPatternBeen consolidating for 4 months forming a rectangle chart pattern. A daily close above rectangle resistance would set the stage for the next leg up.


AUD PLN big gains incoming - resistance break!hey guys resistance on 4 hr / 7 hr broke
we can make a 5th wave up from elliot count for big gains


AUDPLNPrice has broken above daily 200ma and pullback for continuation of trend need to see daily macd cross above zero then buy setup
on 240 min


AUDPLN: possible SELL setupHead and Shoulder setup forming at confluent area:
- major resistance level
- 2.9 round price number
- Fib 0.38 level

