38.2% & POSSIBLE 61.8% Retracement LONG GWAVE38.2% & POSSIBLE 61.8% Retracement LONG GWAVE.
FIB Retracement Percentage is calculated in a Higher Cartesian and or Euclidean Dimension.
PLEASE ALWAYS WAIT FOR STOCHASTIC CONFIRMATION!!! THANKS
AUDSGD trade ideas


There is a possibility for the beginning of an uptrend in AUDSGDMidterm forecast:
While the price is above the support 0.9105, beginning of uptrend is expected.
We make sure when the resistance at 0.9520 breaks.
If the support at 0.9105 is broken, the short-term forecast -beginning of uptrend- will be invalid.
Technical analysis:
A trough is formed in daily chart at 0.9270 on 10/24/2019, so more gains to resistance(s) 0.9400, 0.9455 and maximum to Major Resistance (0.9520) is expected.
Price is above WEMA21, if price drops more, this line can act as dynamic support against more losses.
Relative strength index (RSI) is 54.
Trading suggestion:
. There is a possibility of temporary retracement to suggested support zone (0.93200 to 0.92700). if so, traders can set orders based on Price Action and expect to reach short-term targets.
Beginning of entry zone (0.93200)
Ending of entry zone (0.92700)
Entry signal:
Signal to enter the market occurs when the price comes to " Buy zone " then forms one of the reversal patterns, whether " Bullish Engulfing ", " Hammer " or " Valley " in other words, NO entry signal when the price comes to the zone BUT after any of reversal patterns is formed in the zone. To learn more about " Entry signal " and the special version of our " Price Action " strategy FOLLOW our lessons :
Take Profits:
TP1= @ 0.94000
TP2= @ 0.94550
TP3= @ 0.95200
TP4= @ 0.95950
TP5= @ 0.97250
TP6= @ 0.98300
TP7= @ 1.00900
TP8= @ 1.02250
TP9= Free


Aud/Sgd Close to major daily trendline, rising/decending channelCould enter a short if price accepts support in the smaller falling wedge.
Trading for @swingfish.trade, Join the Community! Its free!
www.swingfish.trade
Lending/Investment:
www.enfoid.com
Prop trading:
www.enfoid.com


AUDSGD: Medium term Sell Opportunity.The pair is trading within a 1W Falling Wegde (RSI = 38.277, MACD = -0.007, Highs/Lows = -0.0017) within a wider 1M Channel Down (RSI = 32.243, MACD = -0.023, Highs/Lows = -0.0181). Both patterns call for a new Lower Low which should hit at least 0.92000.
** If you like our free content follow our profile (www.tradingview.com) to get more daily ideas. **
Comments and likes are greatly appreciated.

AUD/SGD: Good moment to go SELLI've been following this pair since several months and I think this is a good moment to put sell orders for both scalp and swing.
What do you think?

Bullish Divergence on the AUDSGD 1W chart.Price appears to reach a historical strong support.
AUD might start making a turn around in a month or two?
Or will it plunge even lower?
Will continue to monitor the PRISM oscillators + CYBER ENSEMBLE
PRISM Oscillators
CYBER ENSEMBLE
Also see:
Relative Candle Volatility & Directionality Index (RCVI/RCDI)
and
PRISM Signals (which Cyber Momentum Strategy is based on)

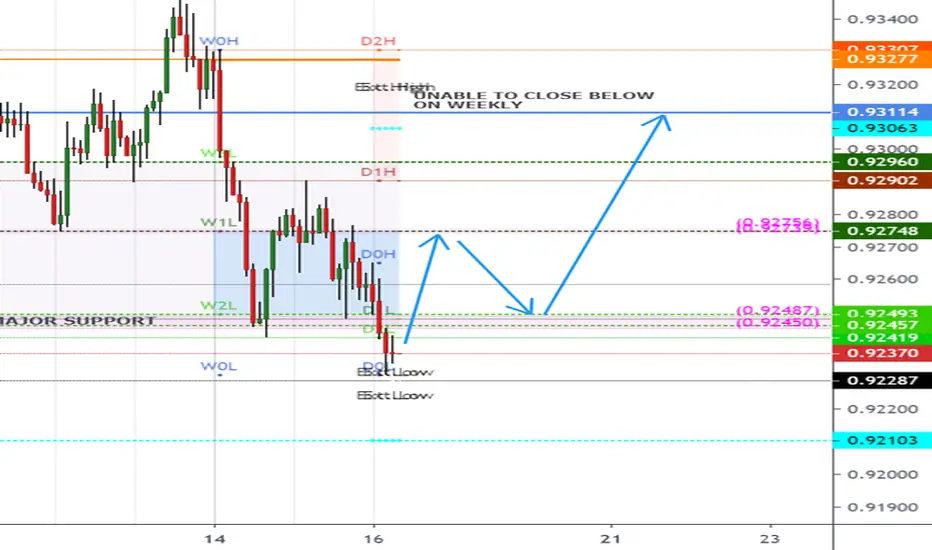
HOLDING WEEKLY LOWSfor the past 3 weeks, the price is unable to close below 0.9313 area. today it traded below the recent lows, if we are able to close back up above 0.9249 today, am predicting we should go back up above 0.9313 area before the end of this week close.
AUDSGD Sell SignalPattern: Channel Down on 1M.
Signal: Bearish as the price is coming off a rejection on the 1D MA50.
Target: 0.9200.


AUDSGD: Sell OpportunityI am looking for this trend continuation trade on AUDSGD.
Targets on the chart.
Thank you for your likes and support:)
Trade with care!
Good Luck

Trading on divergence signalsEDUCATIONAL PURPOSES:
There are several indicators that one can employ during the course of analysis. One common indicator will be the Relative Strength Index.
What can you draw from this indicator?
Overbought and Oversold signals!
However, one can also use this indicator to spot divergences in the price and the relative strength!
Above are 3 examples of RSI divergences: AUDCAD, AUDSGD and GBPAUD.
The main idea is to look out for differing directions between the price and the RSI within the same period.
As we can see from AUDCAD and AUDSGD, price was creating lower lows while RSI was creating higher lows. This is an example of a BULLISH RSI DIVERGENCE, and price will soon start correcting.
In the case of GBPAUD, another higher high on the price carves out a lower high on the RSI. This shows that there is a BEARISH RSI DIVERGENCE, and price will soon start correcting.
Spotting divergences helps with timing of trade entries (whether it is too late or too early), exiting of positions and/or adding more positions. You can also use this as a trigger for a trade (i.e. a Long trade in AUDCAD, or a Short trade in GBPAUD).
The time frame that you use to spot divergences will affect how long you have to wait for price to start correcting (i.e. shorter time for H1 as compared to Daily).
**One important point to note when spotting or trading on divergences: Observe for price action in line with your bias (bullish price action for bullish RSI divergence, vice versa).
RSI divergences can fail should it carve a higher high or lower low that is in line with price.


#AUDSGDThe green areas are Target
Purple ranges are important and strong
Support and resistance are specified
Time range specified
Price is within channel
Look at the trend lines

AUDSGD has made a new low for September now retestingH4 Chart shows Fib .382 at 3345. Fib levels from down leg starting at 19th September ones to watch for possible continuation of downward move

AUDSGD 21/09/2019Hello Traders!
We play with Smartmoney concepts, that means that we look mostly on PA to determine what will happen in future.
As we all know, price is moved by BIG players: Banks, Institutional traders, HFT bots (we call them all of them SM).
They can't play as we do, cause of a HUGE lot sizes, so cause of that they need to SELL to BUY and BUY to SELL for positioning them self in the best possible spot.
If u were learn about trading from free and accessible knowledge, u probably heard about BUYing LOW and SELLing HIGH?
So SM must BUY LOWER and SELL HIGHER :)
We as retail traders are just a small fish in this ocean, so we need to catch the waves which are created by SM.
Here u will find a thought process to identify these spots on chart, where SM stuck with their orders.
We want to play with SM so, we looking for entries (depending of direction) on HEC in 3 spots:
- top of WICK
- top/bottom of BODY candle
- 50% of BODY candle
CHARTS AGENDA:
SM - SMART MONEY
PA - PRICE ACTION
HEC - HIGH ENERGETIC CANDLE (LAST OPPOSITE CANDLE BEFORE MOVE) <- SM MUST SELL TO BUY AND BUY TO SELL :)
BITCOIN SIGN - MONEY POCKET (SL, BUY STOPS, SELL STOPS) - EQH - EQUAL HIGHS / EQL - EQUAL LOWS
BLACK ARROWS ARE ABOVE AND BELOW THESE MONEY SPOTS POINTING FUTURE TARGETS
BLUE LINES - ENTRIES WITH SMART MONEY
MITIGATION MOVE - SNIPER ENTRY FOR US
BLACK LINES FOOT PRINTS - SPOTS ON CHART WHERE SMART MONEY SHOULD COME BACK TO GET OUT OF THEIR POSITIONS IN DRAWDOWN (SM MUST SELL TO BUY AND BUY TO SELL) - POTENCIAL SNIPER ENTRIES
BLACK BOX - GAP's (IPA - INSUFFICIENT PRICE ACTION) - SPOTS ON CHART WHERE PRICE MOVED TOO FAST, AND LEFT SOME "WHOLES" IN PRICE ACTION WHERE ALGORITHMS WHAT TO COME BACK AND FILL IT BY "HEALTHY" PA.
Hopefully u will get some value from this markups;)
GOD BLESS U ALL!

AUDSGD Trading IdeasWe see on daily structure AUDSGD in down trend
Now we see AUDSGD make support and resistance and break the support.
We will wait for monday morning, how price action make a confirmation.
We see triple top pattern on 15M time frame, we can make it for confirmation in lower timeframe to take a confluent trade.
Now we will waiting for higher time frame to make last confirmation
Good luck
