LOOONGupdate on a post a long time ago broken out of that consolidation box , anticipation a break out on that trendline , last time price was rejected, however we are retesting that ,
AUDSGD trade ideas

AUDSGD: Bullish FlagHello traders!
I am looking for this buy opportunity on AUDSGD after it completed a nice bullish flag. Targets on the chart.
Thank you for your likes and support:)
Trade with care!
Good Luck!


BUY AUDSGD @ 0.94000, TARGET 0.94870, SL 0.9375. Buy breakout happend. So this call will be done. Will retrace the target .(BUY AUDSGD @ 0.94000, TARGET 0.94870, SL 0.9375)


AUD SGD BUY (AUSTRALIAN DOLLAR - SINGAPORE DOLLAR)Hi there. Price is forming a continuation pattern to the upside. Wait for the price to hit the bottom of the pattern and watch strong price action for buy.

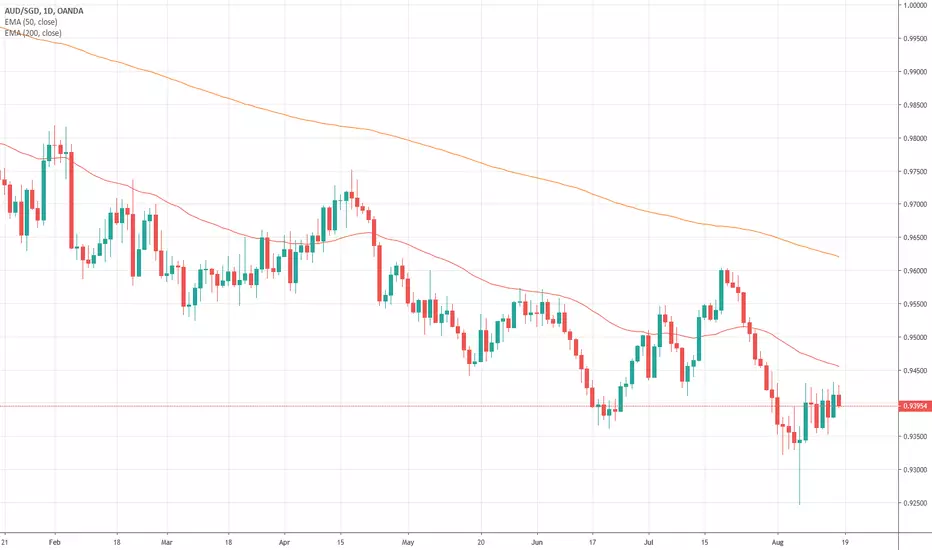
Aussie dollar continuing to find resistance against Singapore doThe Australian dollar initially tried to rally during the day on Friday but continues to run into a lot of pressure against the Singapore dollar. This is a proxy for risk in Asia, so it makes quite a bit of sense that we will roll over from here as there are a lot of concerns when it comes to economic growth in Asia as the US/China trade situation continues to cause major ripple effects around the world.
Looking at the chart, you can see the 50 day EMA is just above, and we have formed several wicks just above the 0.95 handle. It’s very likely that we could go down here and reach towards the 0.9250 level. Ultimately, it’s going to be more of a grind but I can also make an argument that if we were to break above the 0.9440 level, then it would show an attempt to break above the 50 day EMA. A move above there has the market looking towards the 0.95 handle.
Simply put, this is a great proxy for risk appetite, so I think that you should pay attention to stock markets. If stock markets start to roll over in a bit of a “risk off” move, that should put downward pressure on this pair and send it much lower. After all, we are in a downtrend anyways so it makes quite a bit of sense that we will more than likely see that move. It’s going to be a grind, but it makes more sense that we go down than up. This pair doesn’t move very quickly so you need to be patient to wait for your profits to appear. Sudden moves aren’t typical with this pair, so keep that in mind if you are putting money to work.


AUDSGD is near Mirror LevelWe can see support zone here.
The price can bounce from Mirror Level 0.93947 again.

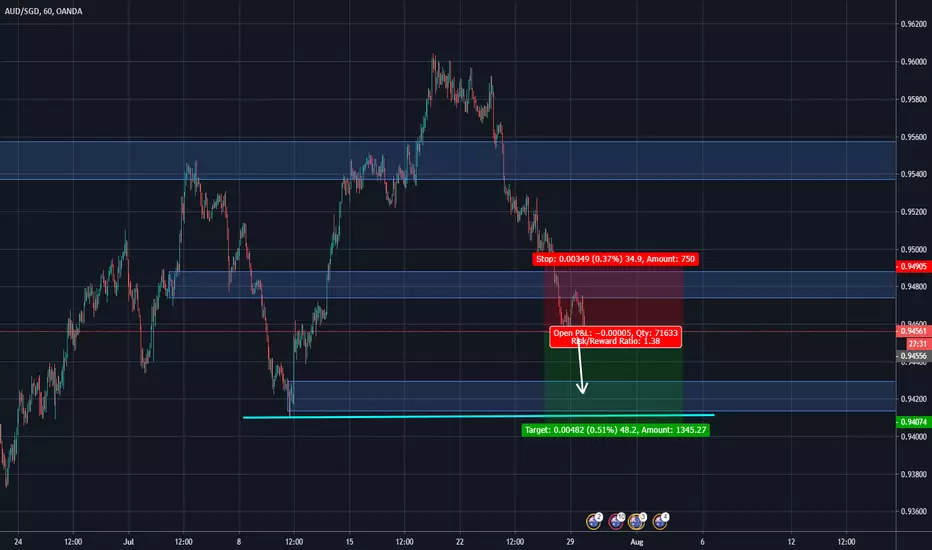
AUD/SGD short sellAUD/SGD short sell position.
follow Money management rules.
Entry - CMP
SL - 0.94258
TP - 0.93553


AUDSGD above Mirror LevelAUDSGD crossed the Mirror Level 0.93939.
We can open short term BUY if the price will pullback to Zone.


AUDSGDTP hit and price still dropping watching the low area we may see a long term sell off down to that area
But we will wait and see how price moves

AUDSGDRan as expected but just short for the TP mark - s3.tradingview.com
Lows were not broken we might have lower price after this pullback so lets wait and see

Trading the Trendi base my trade using pivot and trend.
this is not a trade signal but a personal chart and journal.
but feel free to follow and comment.

AUD/SGD (LONG - BUY)AUD/SGD (LONG - BUY)
On the weekly chart the AUD/SGD have just completed a Minor (weeks) Elliot wave cycle. The daily chart have just completed wave 4 on a Minute (days) Elliot wave cycle and a trend reversal on the daily and 4 hourly is therefore expected towards an expected uptrend.
Elliott Wave Theory Categories:
Grand Supercycle (multi-century)
Supercycle (about 40–70 years)
Cycle (one year to several years)
Primary (a few months to a couple of years)
Intermediate (weeks to months)
Minor (weeks)
Minute (days)
Minuette (hours)
Sub-Minuette (minutes)
A Descending Triangle has formed on the monthly chart which indicated a trend reversal and therefore a possible beginning of a new uptrend if the monthly support line remains strong. In descending triangle chart patterns, there is a string of lower highs which forms the upper line. The lower line is a support level in which the price cannot seem to break.
The monthly trend is Bearish
The weekly trend is Bearish
The Daily trend is Bullish
The H4 trend is Bullish
Institutional Order Flow Areas (aka Supply & Demand):
Institutional Order Flow Areas (Demand) has been resisted once on the hourly chart
Currency Strength Indication:
Weekly: The SGD is slightly stronger than the AUD
Fundamental Consideration for the week:
AUD High: 3
AUD Medium: 1
SGD High: 0
SGD Medium: 0
Entry:
Entry at: 0.94568
Take Profit:
TP1: 0.95089 (move SL to TP1 once reached)
TP2: 0.95318
TP3: 0.95921
Stop Loss:
Stop Loss at around 0.94092
Good Luck – Trade Responsible.
Use 1% risk per Position!
Always strive to continuously improve your trading strategy and knowledge

LONG (1Day) - Inverted Head and shoulderWe can see AUDSGD back test the neck line. Long here with a little loss and big frofit.
Cutloss if falling over Marobuzo candle.
Target 0.973


AUDSGD Sell SignalPattern: Neutral trading between support and resistance levels.
Signal: Bearish after the formation of a Double Top.
Target: 0.94400.
