AUDSGD: Ascending ChannelThe price is testing a strong resistance area in the 4-hour time frame.
The channel is almost perfect.
The probability is too high for a downward movement.
Targets:
0.9896
0.9822
Thank you and Good Luck!
AUDSGD trade ideas

Strong sell AUDSGD is at a very strong level of resistance and sellers might push the price back down for the retest

Buying opportunity with AUDSGDH1 time frame.
Structure: uptrend.
AUDSGD retested Key level at 0.99000.
Here, wait for a confirmed bullish pattern to appear, then you can enter a buy order.
The profit target is the 1.00200 zone.
-----------------------------------------------------------------------------------------------
Wish you all have a good trading day!


AUDSGD trading IdeaIf AUDSGD takes support around 0.9759 level, it is possible to hear up to 1.0018. Also, if it breaks down to the 0.9759 level it will go down to 0.9552 or more. I will see the decision on 0.9759 level.

possible shortwaiting for the price to break to the downside
after the retest, i will be taking a nice short with a good risk to reward ratio

Potential Turning point for AUDSGDWatch it closely for a fast quick short?
Hello there!
If you like my analysis and it helped you ,do give me a thumbs ups on tradingview! 🙏
And if you would like to show further support for me, you can gift me some coins on tradingview! 😁
Thank you!
Disclaimers:
The analysis shared through this channel are purely for educational and entertainment purposes only. They are by no means professional advice for individual/s to enter trades for investment or trading purposes.
The author/producer of these content shall not and will not be responsible for any form of financial/physical/assets losses incurred from trades executed from the derived conclusion of the individual from these content shared.
Thank you, and please do your due diligence before any putting on any trades!


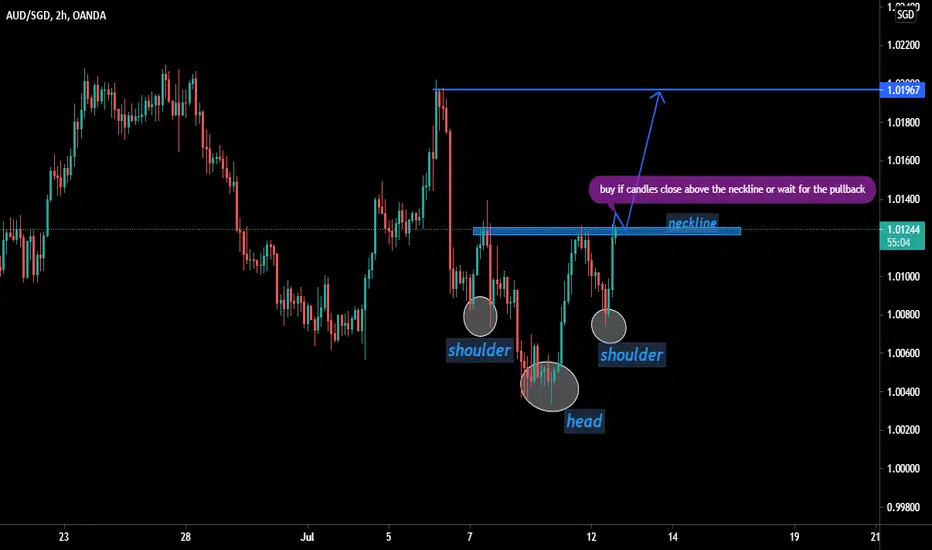
how to trade head and shoulder pattern wait for the candle to close above the structure or neckline, wait for the pullback
The Bottom Line
Head and shoulders patterns occur on all time frames and can be seen visually. While subjective at times, the complete pattern provides entries, stops, and profit targets, making it easy to implement a trading strategy. The pattern is composed of a left shoulder, a head, then a right shoulder. The most common entry point is a breakout of the neckline, with a stop above (market top) or below (market bottom) the right shoulder. The profit target is the difference of the high and low with the pattern added (market bottom) or subtracted (market top) from the breakout price. The system is not perfect, but it does provide a method of trading the markets based on logical price movements.

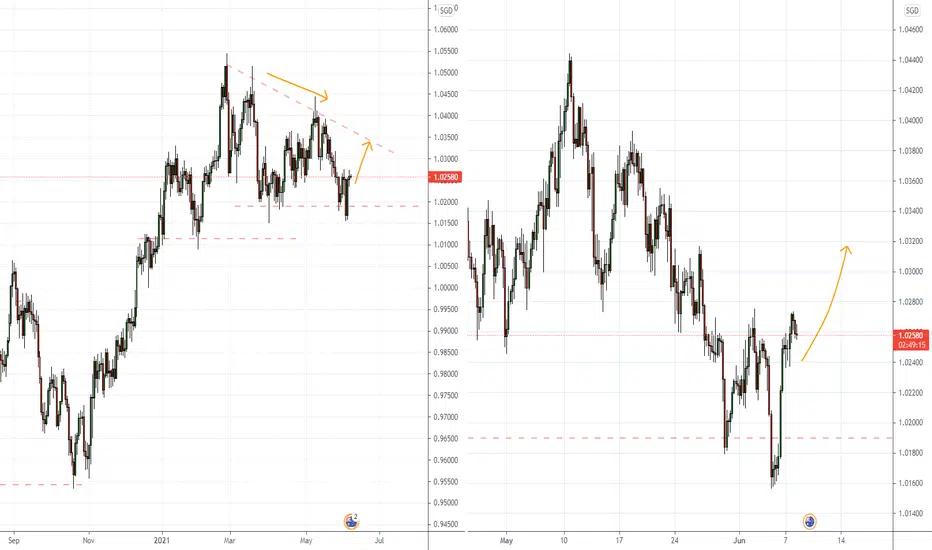
audsgd potential pullback to long and target 1.02 again...
Hello there!
If you like my analysis and it helped you ,do give me a thumbs ups on tradingview! 🙏
And if you would like to show further support for me, you can gift me some coins on tradingview! 😁
Thank you!
Disclaimers:
The analysis shared through this channel are purely for educational and entertainment purposes only. They are by no means professional advice for individual/s to enter trades for investment or trading purposes.
The author/producer of these content shall not and will not be responsible for any form of financial/physical/assets losses incurred from trades executed from the derived conclusion of the individual from these content shared.
Thank you, and please do your due diligence before any putting on any trades!

AUDSGD for a lower low 🦐AUDSGD has reached the weekly support at the 1.0100.
According to Plancton's strategy if the market will break below we can set a nice short order for a continuation of the descending channel trend.
–––––
Follow the Shrimp 🦐
Keep in mind.
• 🟣 Purple structure -> Monthly structure.
• 🔴 Red structure -> Weekly structure.
• 🔵 Blue structure -> Daily structure.
• 🟡 Yellow structure -> 4h structure.
• ⚫️ Black structure -> >4h structure.
Here is the Plancton0618 technical analysis , please comment below if you have any question.
The ENTRY in the market will be taken only if the condition of the Plancton0618 strategy will trigger.

AUDSGD likely to continue its downwards move ?Watch the level
Hello there!
If you like my analysis and it helped you ,do give me a thumbs ups on tradingview! 🙏
And if you would like to show further support for me, you can gift me some coins on tradingview! 😁
Thank you!
Disclaimers:
The analysis shared through this channel are purely for educational and entertainment purposes only. They are by no means professional advice for individual/s to enter trades for investment or trading purposes.
The author/producer of these content shall not and will not be responsible for any form of financial/physical/assets losses incurred from trades executed from the derived conclusion of the individual from these content shared.
Thank you, and please do your due diligence before any putting on any trades!


Support & Resistance VS Supply & Demand | ForexBeeSupport and resistance are the zones from where most of the sellers/buyers are willing to place their orders. for example, a round number 1.30000 will also act as an S&R zone due to psychological level.
price bounces from support and resistance zones many times and it always remains valid. More bounces mean a stronger zone.
.
.
Whereas the supply and demand zone is an area where big institutions place their pending orders. when price fills pending order from zone then demand or supply is consumed. it is no longer valid now. it does not work like bouncing, again and again, in support and resistance.
This is the main difference.
Learn more at forexbee

AUDSGD will it push higher from 1.02 support?If you like my analysis and it helped you ,do give me a thumbs ups on tradingview! 🙏
And if you would like to show further support for me, you can gift me some coins on tradingview! 😁
Thank you!
Disclaimers:
The analysis shared through this channel are purely for educational and entertainment purposes only. They are by no means professional advice for individual/s to enter trades for investment or trading purposes.
The author/producer of these content shall not and will not be responsible for any form of financial/physical/assets losses incurred from trades executed from the derived conclusion of the individual from these content shared.
Thank you, and please do your due diligence before any putting on any trades!


AUDSGD possible scenario 🦐AUDSGD on the 4h chart has tested the support at the 1.02 level.
The price bounces over the descending channel trendline and we can expect a test of the resistance at 1.025.
According to plancton's strategy if the market will provide us a sign of inversion we will set a nice short order according to Plancton's stratgey.
–––––
Follow the Shrimp 🦐
Keep in mind.
• 🟣 Purple structure -> Monthly structure.
• 🔴 Red structure -> Weekly structure.
• 🔵 Blue structure -> Daily structure.
• 🟡 Yellow structure -> 4h structure.
• ⚫️ Black structure -> >4h structure.
Here is the Plancton0618 technical analysis , please comment below if you have any question.
The ENTRY in the market will be taken only if the condition of the Plancton0618 strategy will trigger.


