AUDUSD Potential UpsidesHey Traders, in today's trading session we are monitoring AUDUSD for a buying opportunity around 0.63800 zone, AUDUSD is trading in an uptrend and currently is in a correction phase in which it is approaching the trend at 0.63800 support and resistance area.
Trade safe, Joe.
AUDUSD trade ideas

AUDUSD Potential UpsidesHey Traders, in today's trading session we are monitoring AUDUSD for a buying opportunity around 0.65300 zone, AUDUSD is trading in an uptrend and currently is in a correction phase in which it is approaching the trend at 0.65300 support and resistance area.
Trade safe, Joe.

AUDUSD Analysis – Falling from the Rising WedgeAUDUSD pair broke below an ascending wedge, a bearish reversal pattern.
Clean rejection from 0.6518, with lower highs and new lower lows confirming bearish momentum.
Price is now sitting below former trendline support, retested and respected as resistance.
Bearish target points toward 0.6400–0.6380 zone, aligning with recent swing lows.
Risk invalidation sits above 0.6520, where structure fails.
Technical Bias: Bearish
Target: 0.6400
Stop-loss zone: Above 0.6520
📊 Current Bias: Bearish
🔍 Key Fundamentals Driving AUDUSD
AUD Fundamentals (Weakening):
Australian jobs data was mixed, and wage growth has plateaued.
RBA remains cautious, with expectations for rate cuts later in 2025.
AUD pressured by China growth risks and weak commodity demand.
Geopolitical drag: Australia-China tensions and weak Chinese retail data from 618 Festival dampen AUD outlook.
USD Fundamentals (Resilient):
USD remains bid on risk-off flows, especially after weak global data and ongoing Middle East tensions.
Fed remains reluctant to cut fast despite disinflation signs – supports the USD.
US data is mixed, but rate cut odds are declining (only one expected in 2025 now per dot plot).
⚠️ Risks to This Bearish View
If China announces new stimulus, AUD could rebound sharply.
A dovish surprise from the Fed (e.g. Powell softening in speeches).
Sharp rebound in risk appetite (e.g. tech-led equity rally).
🗓️ Important Events to Watch
🇨🇳 China industrial profits & PMIs
🇦🇺 RBA Meeting Minutes (July preview hints)
🇺🇸 US Core PCE (June 28)
Global risk tone: watch metals, equities, and geopolitical headlines.
🚀 Which Asset Leads?
AUDUSD is lagging other USD pairs, but will likely lead commodity FX downside if China or metals weaken further.
Watch AUDJPY and EURAUD for further confirmation of risk-off flows and Aussie weakness.

AUD/USD, AUD/JPY: Soft CPI A Gift For RBA Doves?I have long said that the RBA could cut in July, and today's CPI figures all but confirm one is on tap. But with AUD/USD and AUD/JPY are rising, will bears get their say?
Matt Simpson, Market Analyst at City Index and Forex.com

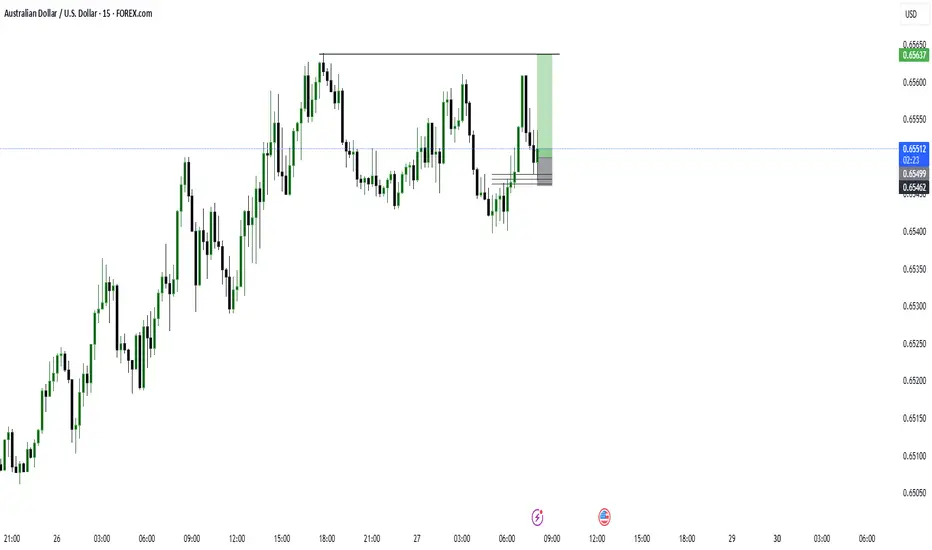
BUY AUDUSDAUDUSD providing buy opportunities hot into NY session.
Buy 0,64911
Target 0,655
Pattern: Inverse Head and Shoulder

AUD/USD Trade Zone!Firstly, we are in a news market right now and news is everything to understanding price action.
After a busy international weekend, AUD/USD opened strong to the sell side. We got the first initial push down last week when Iran attacked Israel. Then, this weekend, Trump struck Iran.
With Trump striking Iran, markets opened bearish initially. After the good news of Iran and Israel coming to peace, we are seeing markets start to rebound a bit.
Where we are currently in the markets is a good structural spot to make some moves. The market has been following a downtrend structure following the Lower-Low, Lower-High pattern and we are currently at the next lower high if the market is going to respect its current market structure.
I am preparing for sells in an overbought market, which is unsure of future international tensions. I am either waiting for a structure break where the gold line indicates or for the market to respect the current structure to play to the low side.
I will be back with future updates.

25.06.25 Morning ForecastPairs on Watch -
FX:AUDUSD
FX:NZDUSD
FX:EURAUD
A short overview of the instruments I am looking at for today, multi-timeframe analysis down to what I will be looking at for an entry. Enjoy!

AUDUSD I Monthly CLS I Model 1 I TR - LiquidityHey, Market Warriors, here is another outlook on this instrument
If you’ve been following me, you already know every setup you see is built around a CLS Footprint, a Key Level, Liquidity and a specific execution model.
If you haven't followed me yet, start now.
My trading system is completely mechanical — designed to remove emotions, opinions, and impulsive decisions. No messy diagonal lines. No random drawings. Just clarity, structure, and execution.
🧩 What is CLS?
CLS is real smart money — the combined power of major investment banks and central banks moving over 6.5 trillion dollars a day. Understanding their operations is key to markets.
✅ Understanding the behavior of CLS allows you to position yourself with the giants during the market manipulations — leading to buying lows and selling highs - cleaner entries, clearer exits, and consistent profits.
📍 Model 1
is right after the manipulation of the CLS candle when CIOD occurs, and we are targeting 50% of the CLS range. H4 CLS ranges supported by HTF go straight to the opposing range.
"Adapt what is useful, reject what is useless, and add what is specifically your own."
— David Perk aka Dave FX Hunter ⚔️
👍 Hit like if you find this analysis helpful, and don't hesitate to comment with your opinions, charts or any questions.

AUDUSD BUY OPPORTUNITY Am waiting for a retest for me to take a buy on AUDUSD
ENTRY: 0.63400
SL: 0.63850
TP: 0.64560
Comment your opinion pls 🙏
For Fund Management. Contact me on X @shajudeakinoba1

AUD/USD: The Rebound TradeThe Australian dollar (also known as the Aussie Battler) looks set to continue its recent bounce. Inflation is now under control and monetary easing will continue to support aggregate demand across the economy. While rate cuts are dovish, the underlying economy is still strong and, as we will explain below, the fiscal situation is shaping up better than expected. Stability is in.
The real action, though, is in the US. Unemployment is creeping up. Jobless claims are ticking higher. Existing home sales are falling. The US consumer is feeling the pinch. That puts pressure on the Fed. Rate cuts are back in the conversation. Markets are already pricing in the first move later this year. The US dollar is losing its grip.
AUD/USD recently tested its 200 day moving average and held firm. That’s more than just a technical level. It’s a psychological line in the sand. The Aussie held its ground.
There’s more. Australia’s fiscal position is likely to come in stronger than expected. Mining exports are holding up. Volumes are rising. That supports the budget bottom line and underpins the Aussie’s credibility as a resource backed currency. This is in stark contrast to most of the developed world, where peers are running large deficits.
This isn’t just about central banks. The global economy is shifting gears. China is stabilising. Industrial demand is returning. Commodity prices are finding a floor. That’s key for the Aussie. It’s still a commodity linked currency. As iron ore and copper pick up, the AUD should follow.
There’s a window here. Over the next twelve months, the AUD has room to move higher, testing the 0.7000 range. Not because Australia is booming, but also because the US is slowing. The Fed is running out of steam. That flips the dynamic. We’re moving from USD strength to USD softness.
The setup is clear. A soft landing in the US. A stable China. Commodities firming. And an RBA on hold. That’s a cocktail for AUD strength.
The bounce has just begun.
The forecasts provided herein are intended for informational purposes only and should not be construed as guarantees of future performance. This is an example only to enhance a consumer's understanding of the strategy being described above and is not to be taken as Blueberry Markets providing personal advice.

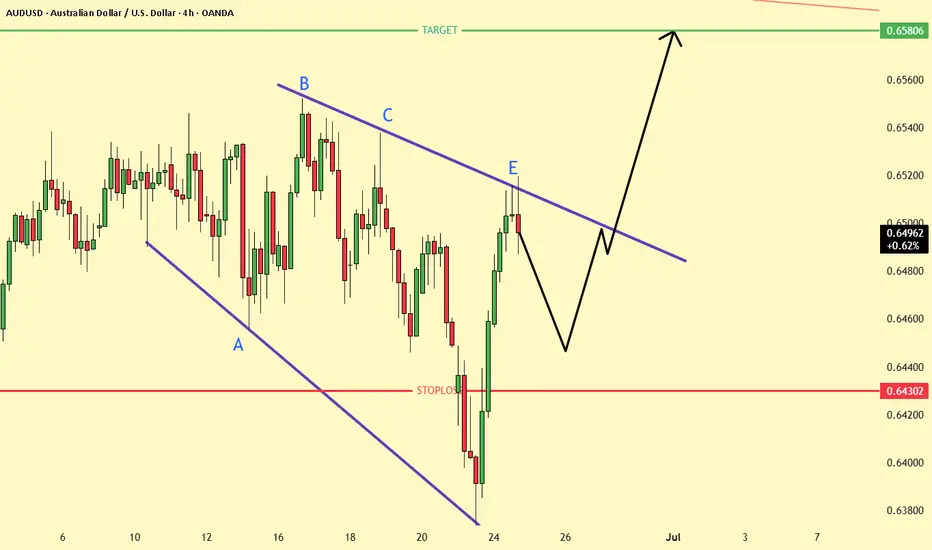
AUDUSD ready for LONG The falling wedge pattern is typically a bullish reversal signal. The structure shows decreasing selling pressure, and a breakout above the resistance trendline could trigger a strong upside move. The entry appears to be after a retest and confirmation.
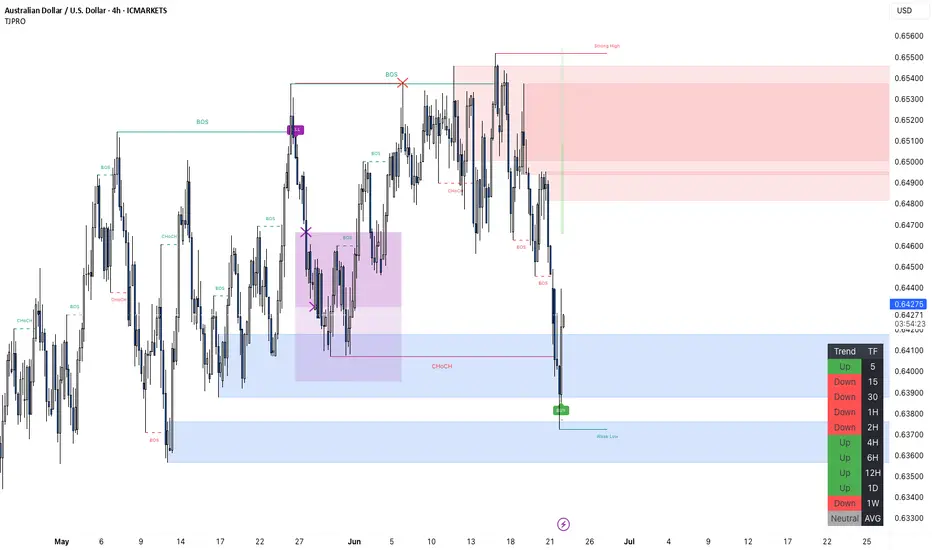
New Bullish Setup on AUD/USD – Targeting 130+ PipsA new BUY signal has emerged on the AUD/USD chart, signaling potential upward movement.
BUY Signal: Activated at 0.64214, indicating a possible reversal from the recent downtrend after price tapped into a higher-timeframe demand zone.
TP Zones:
TP1: 0.64656
TP2: 0.65097
Final TP: 0.65538
This setup offers a potential profit range of 40 to 130 pips.
Market Structure: Price has broken multiple internal lows, creating BOS (Break of Structure) on the way down, but now shows a possible shift in momentum from a fresh demand zone. The setup suggests a bullish correction or reversal toward the imbalance and supply area above.
Remember to manage your trades carefully and ensure this setup fits your overall strategy. Stay sharp and trade responsibly!
AUDUSD 4hour TF - June 29th, 2025AUDUSD 4hour Neutral idea
Monthly - Bearish
Weekly - Bearish
Dailly - Bullish
4hour - Bullish
AU has been in this subtle bullish channel since late April 2025, just above major monthly support at 0.63250 area.
We also have some conflicting trends and we need to see some conviction before we can comfortably follow price action. We do have some alignment with a bearish USD but at the moment we have two options:
Bullish Continuation - This is the most likely scenario based on what we’re seeing and where price action is. Ideally, we see some rejection from our 4hour 0.65000 support area followed by bullish conviction. If this happens look for price action to touch or break the top of this channel and continue bullish for the week ahead.
Reversal back into channel - If we fail to see bullish presence we could see price action fall back into the channel. The key indication of this would be a break below our 0.65000 support area followed by a retest and bearish conviction.

AUDUSD Bullish Ready for long position**Description (AUD/USD Long Setup):**
This is a 1-hour chart of **AUD/USD**, showing a textbook **bullish continuation setup**. The price has recently pulled back in a **bullish flag** (descending channel) and is now showing signs of a breakout above the flag's upper boundary.
Price is reacting from a **Weekly Area of Interest (AOI)** — a zone of previous support — while remaining above the **200 EMA (red)** and reclaiming the **50 EMA (blue)**.
All major timeframes (W, D, 12H, 6H, 4H) are **100% bullish**, adding confluence and confidence to this buy idea.
---
**Why I want to enter Buy:**
* ✅ **Bullish flag breakout** — strong bullish pattern indicating trend continuation.
* ✅ **Price bounced from Weekly AOI** — key support zone respected.
* ✅ **Reclaiming EMAs** — bullish strength returning.
* ✅ **Confluence of timeframes** — momentum aligned from 4H to Weekly.
* ✅ **Great Risk-to-Reward (R\:R)** — defined invalidation below support (Daily AOI), and upside toward **Daily AOI @ 0.66500**.
---
🎯 **Target:** 0.66500
🛡️ **Stop loss:** Just below 0.64500
📈 **Entry idea:** Either aggressive on breakout or conservative on retest of flag breakout / AOI
This setup reflects smart money reaccumulation at a key zone with multi-timeframe alignment — high probability for bullish continuation.

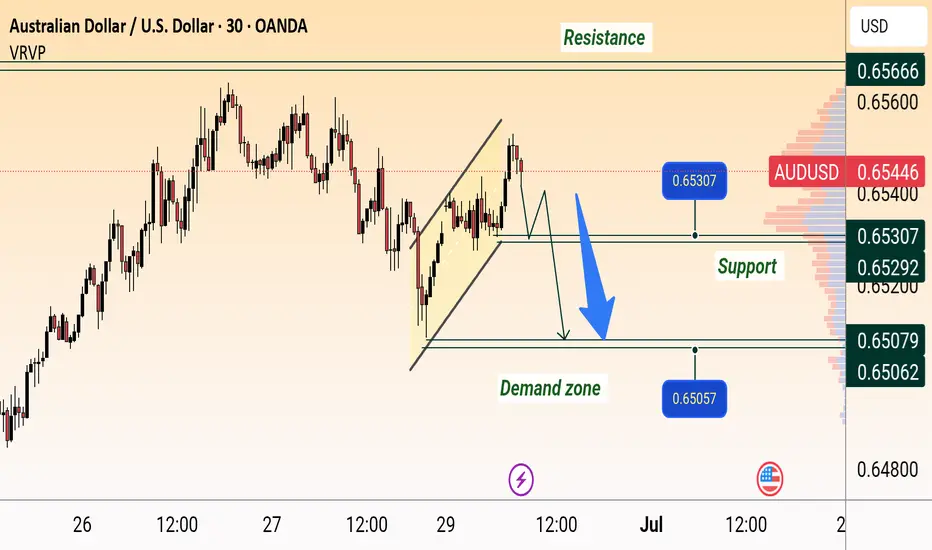
AUD/USD Bearish Reversal SetupAUD/USD Bearish Setup:
Price is showing rejection near resistance around 0.65600 and has broken below the rising channel. A retest of the broken trendline may lead to a drop towards the support zone at 0.65307, and potentially further to the demand zone around 0.65057–0.65000.
AUDUSD TRADE SETUPWait for retest the entry level and bearish momentum then take a trade for Sell othewise skip this setup

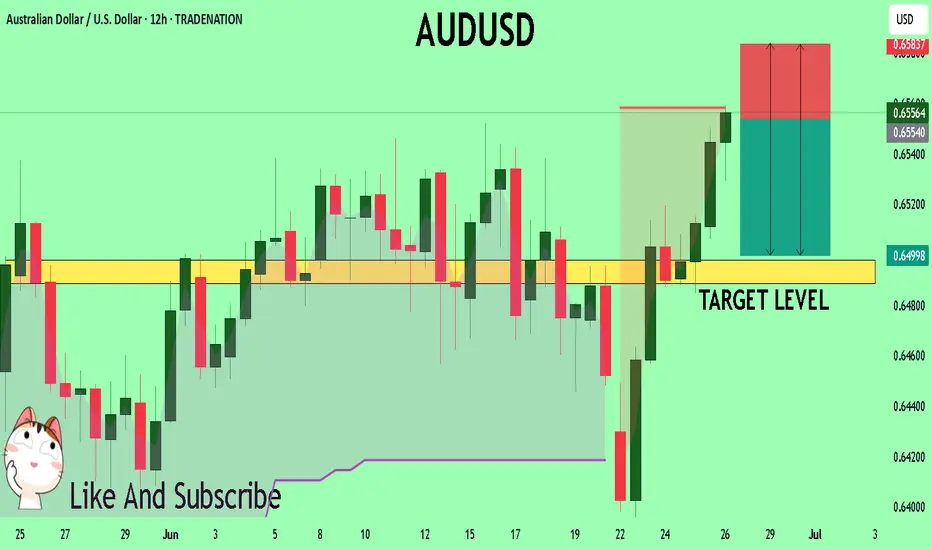
AUD/USD BEARISH BIAS RIGHT NOW| SHORT
AUD/USD SIGNAL
Trade Direction: short
Entry Level: 0.653
Target Level: 0.647
Stop Loss: 0.657
RISK PROFILE
Risk level: medium
Suggested risk: 1%
Timeframe: 9h
Disclosure: I am part of Trade Nation's Influencer program and receive a monthly fee for using their TradingView charts in my analysis.
✅LIKE AND COMMENT MY IDEAS✅

AUD/USD Shows Bullish Hints, Can Gains Be Sustained?Market Analysis: AUD/USD Shows Bullish Hints, Can Gains Be Sustained?
AUD/USD started a decent increase above the 0.6440 and 0.6465 levels.
Important Takeaways for AUD/USD Analysis Today
- The Aussie Dollar rebounded after forming a base above the 0.6370 level against the US Dollar.
- There was a break above a key bearish trend line with resistance at 0.6470 on the hourly chart of AUD/USD at FXOpen.
AUD/USD Technical Analysis
On the hourly chart of AUD/USD at FXOpen, the pair started a fresh increase from the 0.6370 support. The Aussie Dollar was able to clear the 0.6400 resistance to move into a positive zone against the US Dollar.
There was a close above the 0.6440 resistance and the 50-hour simple moving average. There was a break above a key bearish trend line with resistance at 0.6470. Finally, the pair tested the 0.6520 zone. A high was formed near 0.6519 and the pair recently started a consolidation phase.
The pair dipped and tested the 23.6% Fib retracement level of the upward move from the 0.6372 swing low to the 0.6519 high.
On the downside, initial support is near the 0.6485 level. The next major support is near the 0.6465 zone. If there is a downside break below the 0.6465 support, the pair could extend its decline toward the 0.6445 level. It is close to the 50% Fib retracement level.
Any more losses might signal a move toward 0.6405. On the upside, the AUD/USD chart indicates that the pair is now facing resistance near 0.6520. The first major resistance might be 0.6550. An upside break above 0.6580 might send the pair further higher.
The next major resistance is near the 0.6600 level. Any more gains could clear the path for a move toward 0.6650.
This article represents the opinion of the Companies operating under the FXOpen brand only. It is not to be construed as an offer, solicitation, or recommendation with respect to products and services provided by the Companies operating under the FXOpen brand, nor is it to be considered financial advice.

Australian dollar jumps on Israel-Iran cease fireThe Australian dollar is up sharply on Tuesday. In the North American session, AUD/USD is trading at 0.6504, up 0.70% on the day.
Investors' risk appetite is higher today after Israel and Iran agreed to a ceasefire in their 12-day war. The markets have reacted favorably to lower oil prices as fears that Iran would close the Straits of Hormuz, which would have disrupted global oil supplies, have diminished. Risk appetite has returned and risk currencies like the Australian dollar have posted strong gains today.
The Israel-Iran war has triggered sharp swings in oil prices and there are fears of an oil price shock if the fragile ceasefire does not hold. An oil price shock would send petrol prices higher and boost inflation, complicating the Reserve Bank of Australia's plans to lower interest rates.
Australia CPI expected to ease to 2.3%
Australia releases the May inflation report early on Wednesday. Headline CPI has been stuck at 2.4% for three consecutive months, within the Reserve Bank of Australia's target of 2-3% and its lowest level since Nov. 2024. The market estimate for May stands at 2.3%. Trimmed Mean CPI, a key core inflation indication, edged up to 2.8% from 2.7% in April.
The Reserve Bank will be keeping a close eye on the inflation report, with the central bank making a rate announcement on July 8. The RBA trimmed rates by a quarter-point in May and has shifted to a more dovish stance - the Board discussed a jumbo half-point cut at the May meeting.
Fred Chair Powell appears before Congress today and Wednesday and is likely to defend the Fed's wait-and-see stance. The Fed is concerned about President Trump's tariffs and the Israel-Iran war threatens stability in the Middle East, hardly the recipe for further rate cuts. Still, there appears to be some dissent within the Fed, as two members, Michelle Bowman and Christopher Waller, have suggested that the Fed could lower rates as early as September.
AUD/USD is testing resistance at 0.6490. Above, there is resistance at 0.6522
There is support at 0.6400 and 0.6342

AUD/USD – Rejection at 2025 High?By: MJTrading
📉 AUD/USD – Rejection at 2025 High?
The Aussie is struggling at its 2025 high, printing successive lower highs (LH) and flirting with the 60-period EMA. With momentum leaning bearish, a short opportunity opens up near 0.64878, targeting the 0.64094 support zone. Confirmation from the EMA breakdown and rejection wicks strengthens the setup. Stop-loss above 0.65285 protects against a breakout trap.
Entry: 0.64883
Stop Loss: 0.65285
TP1: 0.64500
TP2: 0.64100
#Hashtags: #AUDUSD #ForexTrading #TechnicalAnalysis #ReversalSetup #BearishBias #LowerHighs #EMARejection #ShortThePop #PriceAction

Potential bullish rise?AUD/USD is reacting off the resistance level which is a pullback resistance and could rise from this level to our take profit.
Entry: 0.6537
Why we like it:
There is a pullback resistance level.
Stop loss: 0.6490
Why we like it:
There is an overlap support level.
Take profit: 0.6624
Why we like it:
There is a resistance level that aligns with the 138.2% Fibonacci extension and the 100% Fibonacci projection.
Enjoying your TradingView experience? Review us!
Please be advised that the information presented on TradingView is provided to Vantage (‘Vantage Global Limited’, ‘we’) by a third-party provider (‘Everest Fortune Group’). Please be reminded that you are solely responsible for the trading decisions on your account. There is a very high degree of risk involved in trading. Any information and/or content is intended entirely for research, educational and informational purposes only and does not constitute investment or consultation advice or investment strategy. The information is not tailored to the investment needs of any specific person and therefore does not involve a consideration of any of the investment objectives, financial situation or needs of any viewer that may receive it. Kindly also note that past performance is not a reliable indicator of future results. Actual results may differ materially from those anticipated in forward-looking or past performance statements. We assume no liability as to the accuracy or completeness of any of the information and/or content provided herein and the Company cannot be held responsible for any omission, mistake nor for any loss or damage including without limitation to any loss of profit which may arise from reliance on any information supplied by Everest Fortune Group.

AUDUSD Set To Fall! SELL!
My dear followers,
This is my opinion on the AUDUSD next move:
The asset is approaching an important pivot point 0.6555
Bias - Bearish
Safe Stop Loss - 0.6583
Technical Indicators: Supper Trend generates a clear short signal while Pivot Point HL is currently determining the overall Bearish trend of the market.
Goal - 0.6497
About Used Indicators:
For more efficient signals, super-trend is used in combination with other indicators like Pivot Points.
Disclosure: I am part of Trade Nation's Influencer program and receive a monthly fee for using their TradingView charts in my analysis.
———————————
WISH YOU ALL LUCK