AUDUSDHello Traders! 👋
What are your thoughts on AUDUSD?
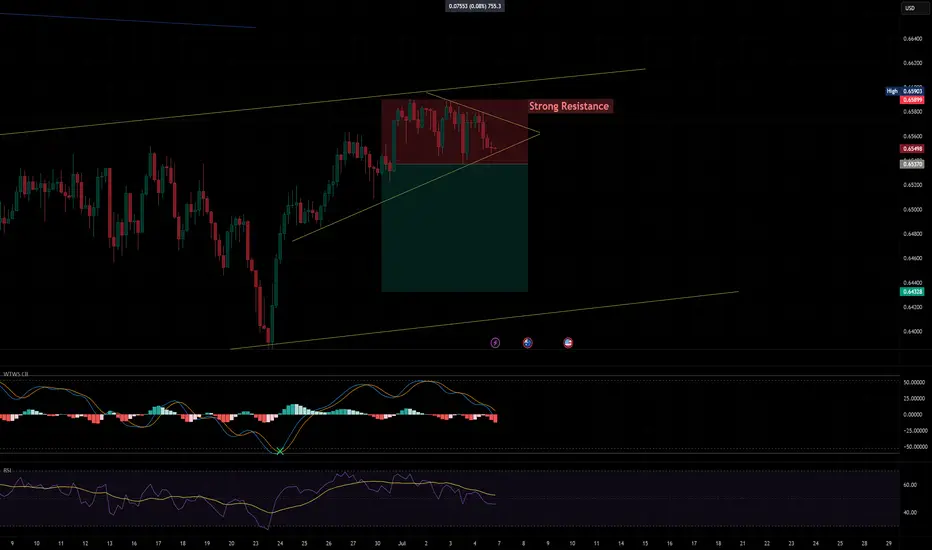
The AUDUSD pair reached a resistance zone, which was accompanied by a negative divergence, signaling weakening bullish momentum. This led to a bearish reaction from that area.
We expect that, after some consolidation around this resistance, the pair will likely continue its decline at least toward the specified support level.
Don’t forget to like and share your thoughts in the comments! ❤️
AUDUSD trade ideas

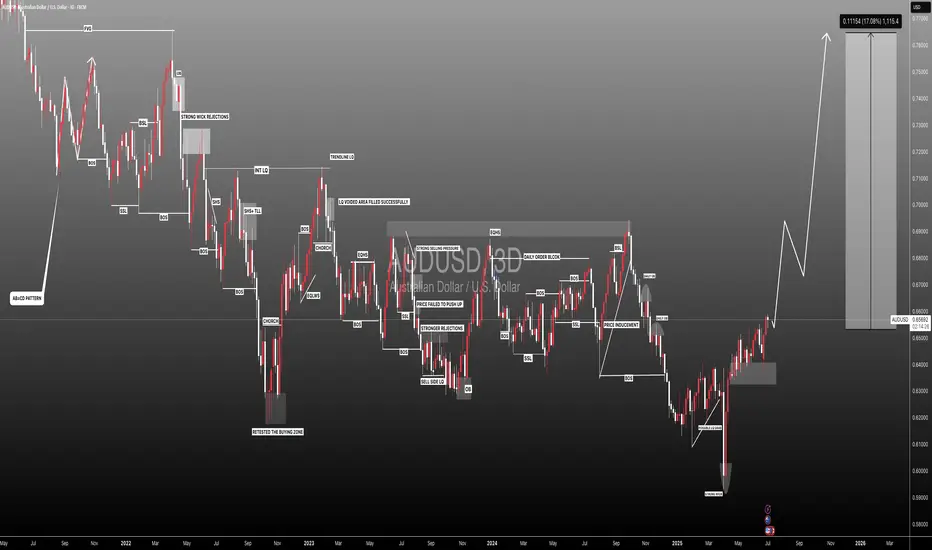
#AUDUSD: +1100 Pips Possible Swing Bullish Move! AUDUSD a strong sign of bullish behaviour has appeared alongside bullish momentum. As we have NFP tomorrow, we expect market to remain volatile; what we think now is to have market settled down before we can have any confirmation. We recommend to remain extra cautious tomorrow, once market get settled we can then enter with accurate risk management.
Like, comment and Share for more!
Team Setupsfx_
AUDUSD Potential UpsidesHey Traders, in today's trading session we are monitoring AUDUSD for a buying opportunity around 0.65500 zone, AUDUSD is trading in an uptrend and currently is in a correction phase in which it is approaching the trend at 0.65500 support and resistance area.
Trade safe, Joe.

Lingrid | AUDUSD capitalizing on the BULLISH ContinuationOANDA:AUDUSD is forming higher lows above the key ascending trendline, showing clear signs of bullish structure continuation. After breaking out of the flag pattern and triangle, price is now consolidating just above the 0.6572 support zone. If buyers hold this level, a breakout toward the 0.6613 resistance area becomes increasingly likely.
📈 Key Levels
Buy zone: 0.6572–0.6580 (above trendline)
Sell trigger: break below 0.6572 trendline support
Target: 0.6613 resistance area
Buy trigger: bounce from trendline and continuation above minor resistance
💡 Risks
Failure to hold the ascending trendline may trigger deeper correction
Low volume during breakout attempts could invalidate the move
Strong resistance at 0.6613 may cause short-term rejection
If this idea resonates with you or you have your own opinion, traders, hit the comments. I’m excited to read your thoughts!

AUDUSDPotential swing trade SHORT!
- Within the daily time frame, we can see it respecting the bearish trendline. is this the retracement towards the downside?
- Bearish engulfing candles on all 3 time frames ( Daily, 4HR, 15M )
- overall bearish market structure in the higher time frame
- USD is starting to pick up some momentum after a rocky past few weeks
- high wicks on our supply zone giving us confirmation of sellers stepping
If you want more trades, or wantimng to get to learn how to trade drop me a message and we can get started

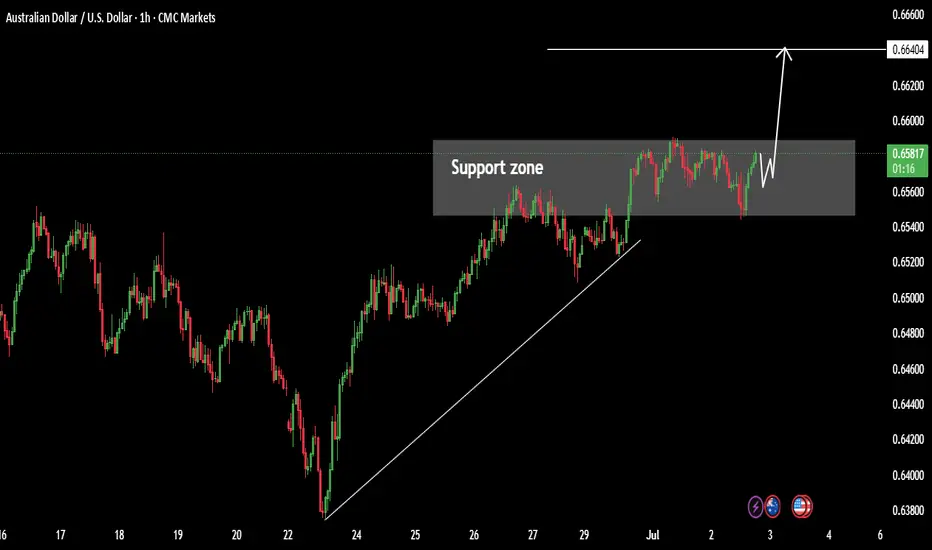
AUDUSD → Pre-breakout consolidation for trend continuationFX:AUDUSD may continue its upward trend. After another local distribution, the currency pair is consolidating and may repeat the cycle
The dollar index continues to fall, the global trend is clear, and the price is testing multi-year lows. After yesterday's speech by Powell, the decline may intensify amid expectations of a rate cut, which will only support AUDUSD.
AUDUSD is moving within an uptrend, stopping below resistance at 0.6583, but is not going to fall.
There was a false breakout (the zone was tested), the structure is not broken, and the price continues to squeeze towards resistance, which could lead to a breakout and growth
Resistance levels: 0.6583
Support levels: 0.6566, 0.6556
There is potential accumulation in the market, and the market is choosing growth against the backdrop of a falling dollar as its direction. Accordingly, the currency pair is one step away from a possible realization phase. Thus, if the price breaks 0.6583 and consolidates above this zone, it may continue to grow in the short and medium term.
Best regards, R. Linda!

AUDUSD Potential UpsidesHey Traders, in today's trading session we are monitoring AUDUSD for a buying opportunity around 0.64600 zone, AUDUSD is trading in an uptrend and currently is in a correction phase in which it is approaching the trend at 0.64600 support and resistance area.
Trade safe, Joe.

AUDUSD 4hour TF - July 6th, 2025AUDUSD 7/6/2025
AUDUSD 4hour Neutral idea
Monthly - Bearish
Weekly - Bearish
Dailly - Bullish
4hour - Ranging
We are still technically bullish overall but we can see here on the 4hour that AU is ranging between 0.65800 & 0.65500. This is a fairly small range so we’re not that interested in taking trades while price action is bouncing between these two zones.
We’re looking for conviction above 0.65800 or below 0.65500 before we can comfortably make a move. Let’s see what both of those situations would look like:
Bullish Continuation - Most of the trend data is suggesting AU is still bullish but we would need to see a strong push above resistance around 0.65800 with a confirmed higher low above before getting into any trades. If we do see this play out I'm looking toward 0.66750 resistance as a target.
Reversal back into channel - Price action seems to be poking out of the bottom of this range but we are still not convinced just yet. For us to strongly consider this a bearish move we would like to see a retest of 0.65500 as resistance followed by bearish conviction. Look for price action to move lower toward key support areas if this happens.

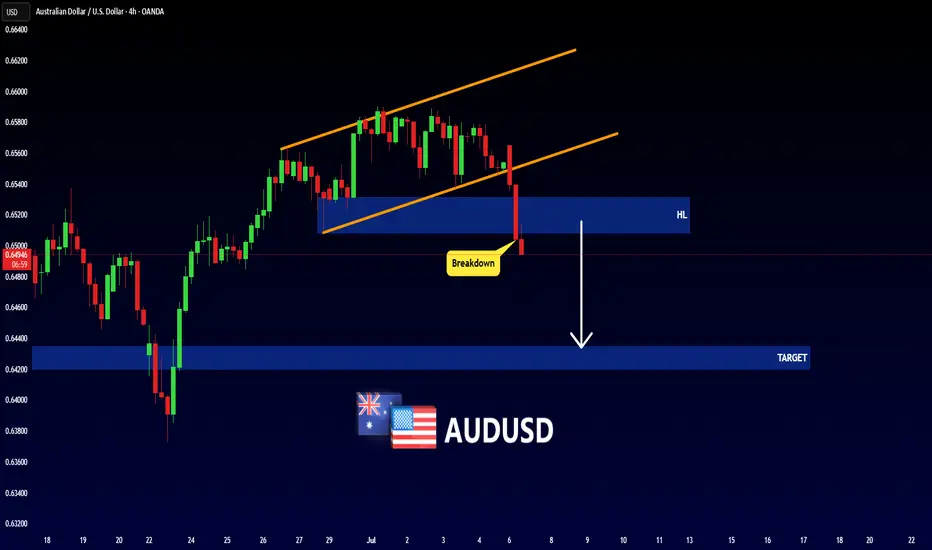
AUDUSD - BEARISH MOVEHello Traders !
The AUDUSD failed to create a new higher high!
The price broke the higher low (change of character).
So, I expect a bearish move📉
_________________
TARGET: 0.64350🎯
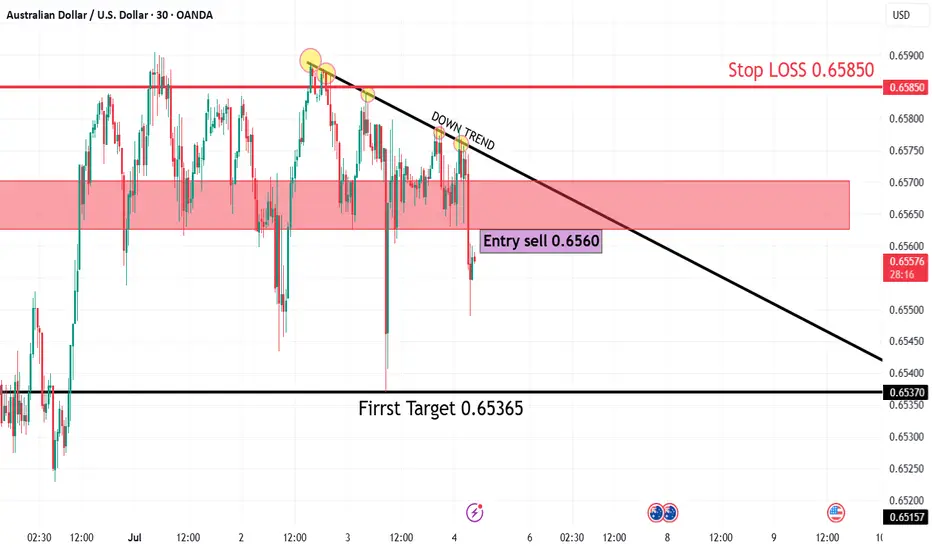
AUD/USD30 Mins Frame
🧠 Technical Overview:
The pair is moving in a clear downtrend, as confirmed by the descending trendline connecting multiple lower highs.
Every bullish attempt has been rejected at this trendline, showing strong seller pressure.
🧩 Key Technical Elements:
1. Downtrend Line:
Accurately drawn across descending highs.
Price has tested and rejected from this line multiple times, confirming its strength as a dynamic resistance.
2. Supply Zone:
Highlighted in red between 0.6565 and 0.6575.
Price entered this zone and was immediately rejected, reinforcing bearish sentiment.
3. Entry Point:
Sell at 0.6560, after price failed to break above both the supply zone and trendline resistance.
4. Stop Loss:
0.65850, placed just above the supply zone and the previous high — a safe level to exit if the setup fails.
5. Target Levels:
First Target: 0.65365 – a minor support level and reasonable short-term target.
Major Target: 0.65157 – a stronger previous support and potential reversal point.
📉 Expected Price Action:
As long as the price stays below the trendline and supply zone, further downside is expected.
The most recent price action shows a false breakout above resistance followed by a sharp drop, typical behavior in a downtrend.
🔥 Risk-to-Reward Ratio (R:R):
First Target:
Risk: 0.65850 – 0.6560 = 25 pips
Reward: 0.6560 – 0.65365 = 23.5 pips
→ R:R ≈ 1:1
Major Target:
Reward: 0.6560 – 0.65157 = 44.3 pips
→ R:R ≈ 1.8:1
✅ Solid R:R ratio especially toward the major target.
✅ Conclusion:
This is a technically sound short setup in line with the dominant downtrend.
The rejection from both the supply zone and trendline strengthens the bearish case.
Suitable for short- to medium-term traders, with clearly defined risk management.
#AUDUSD:We are yet to see weaken USD! AUDUSD to make yearly highAUDUSD hasn’t seen strong bullish volume yet, but tomorrow’s NFP will be crucial for determining the future trend of the AUDUSD. Based on your analysis, you can set multiple targets.
If you like our work and want to support us, you can do so by following us:
-Liking our ideas
-Commenting on our ideas
-Sharing
Team Setupsfx_
❤️🚀

Market Insights with Gary Thomson: 7 - 11 JulyMarket Insights: RBA Cut in Focus, UK GDP Weakens, Canada Jobs, FOMC Clues, Tariff Deadline
From rate decisions to rising unemployment and tariff deadlines, this week’s macro landscape is shaped by evolving dynamics and shifting momentum. If you’re trading FX, commodities, or indices — this is a moment to pay close attention.
In this episode of Market Insights, Gary Thomson unpacks the strategic implications of the week’s biggest events:
— RBA Interest Rate Decision
— UK GDP Growth Rate
— Unemployment Rate in Canada
— FOMC Minutes
— Tariff Deadline
Don’t miss out—gain insights to stay ahead in your trading journey.
This video represents the opinion of the Companies operating under the FXOpen brand only. It is not to be construed as an offer, solicitation, or recommendation with respect to products and services provided by the Companies operating under the FXOpen brand, nor is it to be considered financial advice.

AUDUSD long positionThe AUD/USD 2-hour chart shows a strong buy opportunity as price reacts to a key support zone. Multiple rejections with long lower wicks signal strong buyer interest, suggesting a potential bullish reversal. The setup offers a great risk-to-reward ratio, with a tight stop below support and a wide target above. If price breaks above the 50 EMA, it would further confirm bullish momentum.

AUSUSD Breakout May continue GrowthAUDUSD Looking Precious High Bullish Pattern continue there Uptrend.
Here the some fallowing knowledge about AUSDUSD The dollar continues to bullish the global trend is clear and the price is testing multi year lows after yesterday Speech Powel the decline may continue AUDUSD is moving with in uptrend and move to our target ang catching there strong levels.
Resistance Levels 0.66400
Support Levels 0.65500
Hit the like if you find better analysis like this Hope this analysis is better for trading journey.
if you need any help about regarding trading and any Question share in comments.
A strong resistance level AUDUSD🚨 Perfect Setup Alert!
A strong resistance level is holding firm 🔒 and guess what?
❌ Negative news hitting the Aussie 🇦🇺
✅ Positive momentum backing the US Dollar 🇺🇸
Add to that a week-long overbought zone 📈.
📉 The downtrend has begun — and we're ready to ride the wave of profits! 💰
#AUDUSD
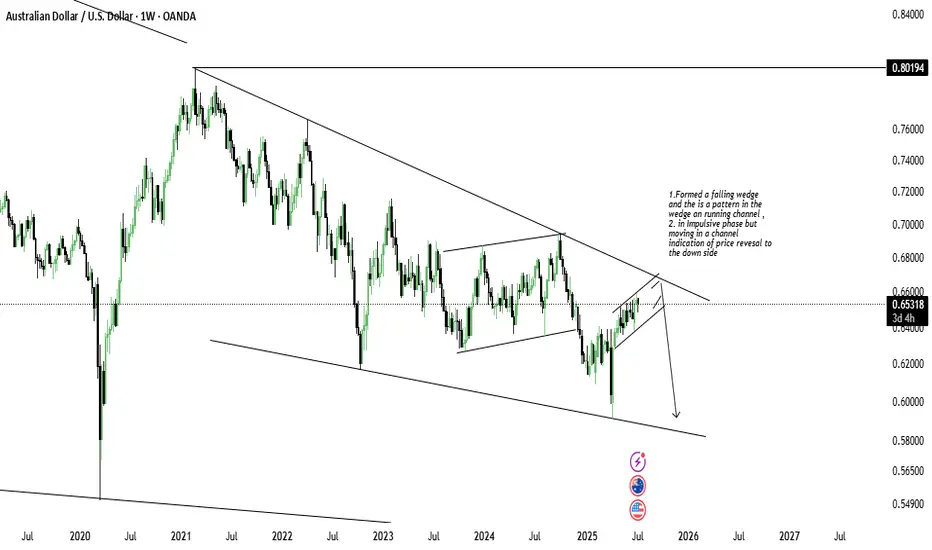
Future sells on AUDUSD 1.Formed a falling wedge and the is a pattern in the wedge an running channel ,
2. in Impulsive phase but moving in a channel indication of price revesal to the down side
AUDUSD 4H: Sell Zone Confirmed📉 AUDUSD Analysis – Current Trend & Trade Opportunity
Hello Traders,
I’ve prepared an updated analysis for the AUDUSD pair.
At the moment, AUDUSD has shifted out of its previous bullish structure and has now entered a bearish trend. Based on this shift, I’m planning to enter a limit sell trade at the level shared below:
🔹 Limit Sell Entry: 0.65232
🔹 Stop Loss: 0.65576
🔹 Targets:
• TP1: 0.64591
• TP2: 0.64591
• TP3: 0.63738
🔸 Risk/Reward Ratio: 4.27
Considering the trend reversal, I’m looking to open a position from these levels.
I meticulously prepare these analyses for you, and I sincerely appreciate your support through likes. Every like from you is my biggest motivation to continue sharing my analyses.
I’m truly grateful for each of you—love to all my followers💙💙💙

AUD/USD - Day Trading Analysis With Volume ProfileOn AUD/USD, it's nice to see a strong sell-off from the price of 0.65470. It's also encouraging to observe a strong volume area where a lot of contracts are accumulated.
I believe that sellers from this area will defend their short positions. When the price returns to this area, strong sellers will push the market down again.
Strong S/R zone from the past and Volume cluster are the main reasons for my decision to go short on this trade.
Happy trading,
Dale

Australian Dollar Strengthens Following RBA DecisionAustralian Dollar Strengthens Following RBA Decision
Today, the AUD/USD pair experienced a spike in volatility. According to ForexFactory, analysts had forecast that the Reserve Bank of Australia (RBA) would cut interest rates from 3.85% to 3.60%. However, the market was caught off guard as the central bank opted to keep rates unchanged.
The RBA stated the following:
→ It remains cautious in its inflation outlook and awaits further evidence confirming that inflation is on track to return to the 2.5% target.
→ The decision to hold the rate was made by a vote of six to three — a rare instance of a split opinion among committee members.
The initial market reaction to the RBA’s unexpected move was a sharp appreciation of the Australian dollar. However, this was followed by a quick pullback in the minutes that followed (as indicated by the arrows).
Technical Analysis of the AUD/USD Chart
Since early July, price action in AUD/USD has been forming a descending channel (marked in red). In this context:
→ Today’s sharp rally and subsequent retracement underscored the significance of the upper boundary of the channel;
→ The pair tested a previously broken ascending trendline (the lower line of the blue channel);
→ Although the price briefly rose above the 0.65450 level, this area may now act as resistance going forward.
There is a possibility that, as forex trading unfolds throughout the day, AUD/USD could retreat towards the median line of the descending channel. Such a move could be interpreted as follows:
→ The initial reaction to the RBA decision may have been premature;
→ Selling pressure persists, which might trigger a move towards the support zone near 0.64850.
Looking ahead, the trajectory of AUD/USD in July 2025 will be largely influenced by developments surrounding a potential trade agreement between the United States and other countries, including Australia.
This article represents the opinion of the Companies operating under the FXOpen brand only. It is not to be construed as an offer, solicitation, or recommendation with respect to products and services provided by the Companies operating under the FXOpen brand, nor is it to be considered financial advice.

AUD/USD Short: Riding the Perfect Storm to 0.6400Hello, traders! 🚀
A rare and powerful setup is forming on AUD/USD, and all signs are pointing decisively lower. 👇 This isn't just a simple technical pattern; it's a perfect storm of fundamental, technical, and event-driven factors aligning to create a high-conviction short opportunity.
If you're looking for a clean setup with a clear catalyst, this is it. Let's break it down! 🧐
The Core Thesis: Why We're Bearish 🌪️
This trade is built on three powerful pillars that are converging at the same time:
Massive Policy Divergence: 🇺🇸 vs 🇦🇺 This is the engine of the trade.
The Fed (USD): Remains HAWKISH 🦅. They are laser-focused on fighting stubborn inflation and have signaled they are in no rush to cut rates.
The RBA (AUD): Is actively DOVISH 🐨. They've already cut rates and are widely expected to cut again this week to support a weakening economy.
Result: This widening gap in interest rate policy creates a fundamental tailwind that heavily favors a stronger USD and a weaker AUD. 💸
The Dual-Catalyst Event (July 9th): 🗓️ This is the trigger.
FOMC Minutes Release: The minutes from the Fed's last meeting are expected to confirm their hawkish stance, reinforcing USD strength.
Tariff Deadline: A 90-day suspension of Trump-era tariffs expires on the same day . The base case is that tariffs will be reimposed, sparking a risk-off move in the markets.
Result: Risk-off sentiment is toxic for the risk-sensitive Aussie dollar (AUD) and a magnet for the safe-haven US dollar (USD). This is a potential double-whammy for AUD/USD. 💥
The Technical Picture is Screaming "Down" 📉
The chart tells a crystal-clear story of rejection and weakness. As you can see on the 4H chart, the price action is incredibly bearish after failing to break out higher.
The Great Wall of Resistance: Bulls threw everything they had at the 0.6590 - 0.6600 resistance zone and were decisively rejected. 🧱 This wasn't just any level; it was an 8-month high and a major long-term resistance area. A failure this strong is a huge red flag for buyers. 🛑
Momentum has Flipped: We saw classic bearish divergence on the higher timeframes, and as you can see on this 4H chart, we have now decisively broken below the recent rising channel. The path of least resistance has flipped from up to down. 👇
The Trade Plan 🎯
Here are the precise levels for executing this trade idea.
Asset: AUD/USD
Direction: Short (Sell) 📉
Entry Zone: ➡️ Look for a patient entry on a pullback to the 0.6535 - 0.6550 area. This was previous support and is now expected to act as strong resistance. We want to sell into strength.
Stop Loss: 🛑 A daily close above 0.6610 . This level is safely above the recent highs. A break here would invalidate our bearish thesis.
Target 1 (TP1): ✅ 0.6475 . This is the first logical support level. A good area to take partial profits and move your stop loss to break-even.
Target 2 (TP2): 🏆 0.6400 . This is our primary target, representing the bottom of the multi-week trading range and offering an excellent risk-to-reward ratio.
Conclusion: 💡
It's rare for fundamentals, technicals, and a major event catalyst to align so perfectly. The rejection at major resistance, combined with the powerful fundamental driver of policy divergence and the upcoming dual-catalyst on July 9th, makes this a high-conviction setup.
This is my analysis and not financial advice. Always do your own research and manage your risk carefully.
What do you think? Are you bearish on the Aussie too? Let me know your thoughts in the comments below! 👇
And if you found this analysis helpful, please give it a BOOST 🚀 and FOLLOW for more trade ideas! 👍

Market Analysis: AUD/USD Attempts Fresh ClimbMarket Analysis: AUD/USD Attempts Fresh Climb
AUD/USD is attempting a fresh increase from the 0.6485 support.
Important Takeaways for AUD/USD Analysis Today
- The Aussie Dollar found support at 0.6485 and recovered against the US Dollar.
- There is a key bearish trend line forming with resistance at 0.6535 on the hourly chart of AUD/USD at FXOpen.
AUD/USD Technical Analysis
On the hourly chart of AUD/USD at FXOpen, the pair started a fresh increase above 0.6550. The Aussie Dollar tested the 0.6585 zone before the bears appeared and pushed it lower against the US Dollar.
The pair declined below the 0.6560 and 0.6550 support levels. The recent low was formed at 0.6485 and the pair is rising again. The bulls pushed it above the 50% Fib retracement level of the downward move from the 0.6588 swing high to the 0.6485 low.
The pair is now consolidating above the 50-hour simple moving average. On the upside, the AUD/USD chart indicates that the resistance is near the 0.6535 zone. There is also a key bearish trend line forming at 0.6535.
The first major resistance might be 0.6550 and the 61.8% Fib retracement level. An upside break above it might send the pair further higher. The next major resistance is near the 0.6560 level. Any more gains could clear the path for a move toward the 0.6585 resistance zone.
If not, the pair might correct lower. Immediate support sits near the 0.6510 level. The next support could be 0.6485. If there is a downside break below 0.6485, the pair could extend its decline toward the 0.6440 zone. Any more losses might signal a move toward 0.6420.
This article represents the opinion of the Companies operating under the FXOpen brand only. It is not to be construed as an offer, solicitation, or recommendation with respect to products and services provided by the Companies operating under the FXOpen brand, nor is it to be considered financial advice.
Could we see bullish continuation?The Aussie (AUD/USD) is reacting off the pivot and could rise to the 1st resistance which aligns with the 161.8% Fibonacci extension.
Pivot: 0.6581
1st Support: 0.6562
1st Resistance: 0.6621
Risk Warning:
Trading Forex and CFDs carries a high level of risk to your capital and you should only trade with money you can afford to lose. Trading Forex and CFDs may not be suitable for all investors, so please ensure that you fully understand the risks involved and seek independent advice if necessary.
Disclaimer:
The above opinions given constitute general market commentary, and do not constitute the opinion or advice of IC Markets or any form of personal or investment advice.
Any opinions, news, research, analyses, prices, other information, or links to third-party sites contained on this website are provided on an "as-is" basis, are intended only to be informative, is not an advice nor a recommendation, nor research, or a record of our trading prices, or an offer of, or solicitation for a transaction in any financial instrument and thus should not be treated as such. The information provided does not involve any specific investment objectives, financial situation and needs of any specific person who may receive it. Please be aware, that past performance is not a reliable indicator of future performance and/or results. Past Performance or Forward-looking scenarios based upon the reasonable beliefs of the third-party provider are not a guarantee of future performance. Actual results may differ materially from those anticipated in forward-looking or past performance statements. IC Markets makes no representation or warranty and assumes no liability as to the accuracy or completeness of the information provided, nor any loss arising from any investment based on a recommendation, forecast or any information supplied by any third-party.

Bullish bounce off pullback support?The Aussie (AUD/USD) has bounced off the pivot and could rise to the 1st resistance, which lines up with the 127.2% Fibonacci extension.
Pivot: 0.6567
1st Support: 0.6544
1st Resistance: 0.6603
Risk Warning:
Trading Forex and CFDs carries a high level of risk to your capital and you should only trade with money you can afford to lose. Trading Forex and CFDs may not be suitable for all investors, so please ensure that you fully understand the risks involved and seek independent advice if necessary.
Disclaimer:
The above opinions given constitute general market commentary, and do not constitute the opinion or advice of IC Markets or any form of personal or investment advice.
Any opinions, news, research, analyses, prices, other information, or links to third-party sites contained on this website are provided on an "as-is" basis, are intended only to be informative, is not an advice nor a recommendation, nor research, or a record of our trading prices, or an offer of, or solicitation for a transaction in any financial instrument and thus should not be treated as such. The information provided does not involve any specific investment objectives, financial situation and needs of any specific person who may receive it. Please be aware, that past performance is not a reliable indicator of future performance and/or results. Past Performance or Forward-looking scenarios based upon the reasonable beliefs of the third-party provider are not a guarantee of future performance. Actual results may differ materially from those anticipated in forward-looking or past performance statements. IC Markets makes no representation or warranty and assumes no liability as to the accuracy or completeness of the information provided, nor any loss arising from any investment based on a recommendation, forecast or any information supplied by any third-party.
