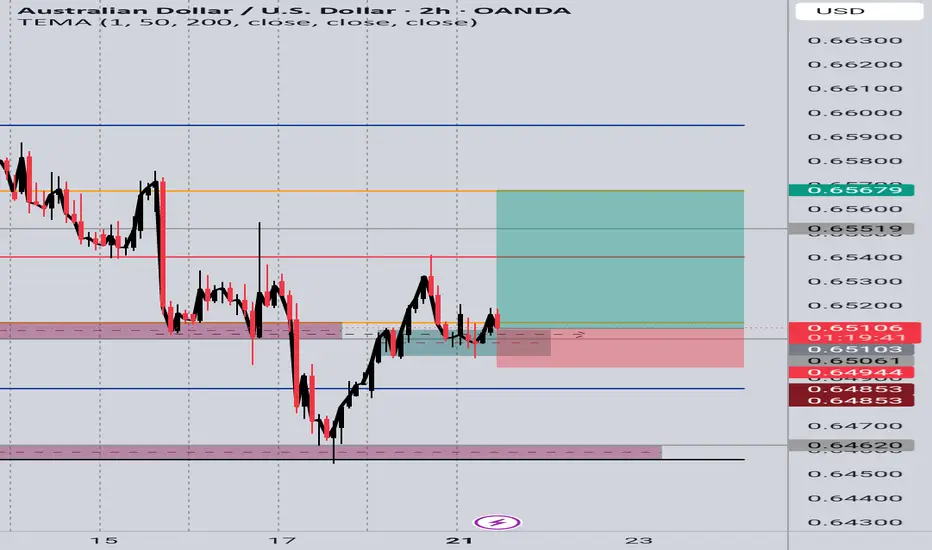
Sell area audusdStrong sell expected from the marked level
Wait to sweep high and high possible to respect the downtrend channel
AUDUSD trade ideas

AUDUSD BullishLooking at the chart displayed. I am looking for this bullish move to possibly happen.

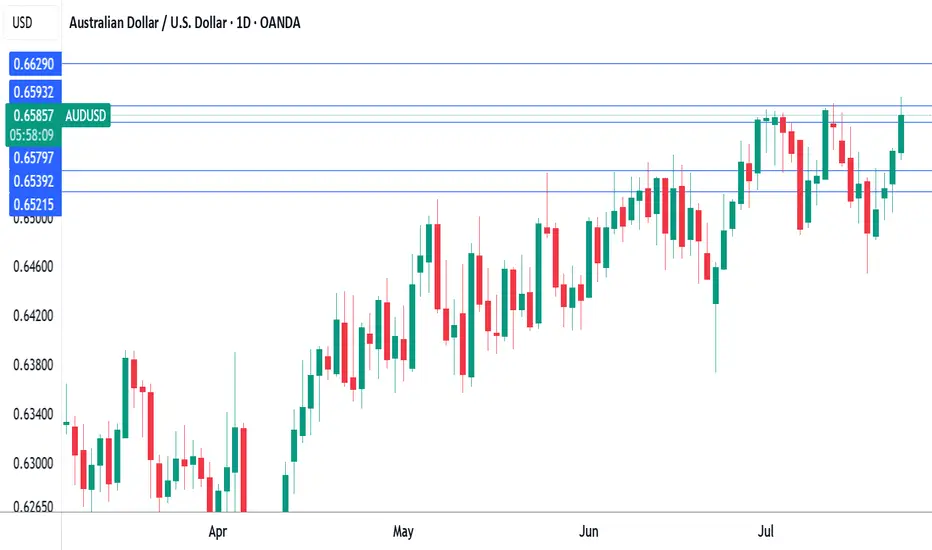
Australian dollar hits eight-month high on risk-on moodThe Australian dollar has rallied for a fourth sucessive day. In the North American session, AUD/USD is trading at 0.6588, up 0.50% on the day. The red-hot Aussie has jumped 1.6% since Thursday and hit a daily high of 0.6600 earlier, its highest level since Nov. 2024.
The financial markets are in a risk-on mood today, buoyed by the announcement that the US and Japan have reached a trade agreement. Under the deal, the US will impose 15% tariffs on Japanese products, including automobiles. As well, Japan will invest some $550 billion into the US.
Global stock markets are higher and the Australian dollar, a gauge of risk appetite, has climbed to an eight-month high.
Investors also reacted positively today to reports that negotiations between the US and China were speeding up and the US could grant an extension of the August 12 deadline to reach an agreement. The latest positive developments on the tariff front have raised hopes that the US will also sign trade deals with the European Union and South Korea.
The White House continues to put pressure on the Federal Reserve. Earlier this week, Treasury Scott Bessent called for a thorough review of the Federal Reserve. Bessent echoed President Trump's calls for the Fed to lower interest rates.
Fed Chair Jerome Powell hasn't shown any signs of plans to cut rates and has fired back that the uncertainty over Trump's trade policy has forced the Fed to adopt a wait-and-see policy. The Fed is widely expected to hold rates at the July 30 meeting but there is a 58% likelihood of a rate cut in September, according to CME's FedWatch.
AUD/USD has pushed above resistance at 0.6579 and tested resistance at 0.6593 earlier. Next, there is resistance at 0.6629
0.6539 and 0.6521 are the next support levels
Buy Aud from pivoton the 1D chart there is some uptrend
on 1H and 4H chart price is testing the pivot line for support
if the support will be strong anought could be good RR

AUD/USD Channel Breakdown Could Threaten Bullish StructureAUD/USD is currently holding just above the 0.6500 psychological level after retreating from the 0.6558 Fibonacci resistance (61.8% retracement of the October–April decline). Price action has recently broken beneath the lower boundary of a rising wedge pattern—a traditionally bearish signal—raising the risk of deeper downside ahead.
The 50-day SMA (0.6498) and 200-day SMA (0.6399) are converging, with the former now acting as dynamic support following today’s bounce. However, momentum indicators offer limited bullish conviction: the RSI hovers near neutral at 51.5, and the MACD is flatlining just above zero, suggesting a pause in directional bias.
If bears push price back under 0.6500, the rising wedge breakdown could accelerate toward the 200-day SMA and potentially the horizontal support zone at 0.6178. On the flip side, a recovery above 0.6558 would invalidate the wedge and open the door for a run toward the 78.6% retracement near 0.6730.
Bias: Cautiously bearish while below 0.6558, especially if daily closes begin to settle under 0.6500. A loss of the 200-day SMA would confirm a trend reversal.
Time frame: Short- to medium-term (days to weeks)
-MW

SELL AUDUSD IF DAILY CANDLE ENDS AS BEARISH ON IDC(THIS CHART)sell AUDUSD and buy USDCAD as the dollar is gaining strength
Signal-to-Noise Ratio: The Most Misunderstood Truth in Trading█ Signal-to-Noise Ratio: The Most Misunderstood Truth in Quant Trading
Most traders obsess over indicators, signals, models, and strategies.
But few ask the one question that defines whether any of it actually works:
❝ How strong is the signal — compared to the noise? ❞
Welcome to the concept of Signal-to-Noise Ratio (SNR) — the invisible force behind why some strategies succeed and most fail.
█ What Is Signal-to-Noise Ratio (SNR)?
⚪ In simple terms:
Signal = the real, meaningful, repeatable part of a price move
Noise = random fluctuations, market chaos, irrelevant variation
SNR = Signal Strength / Noise Level
If your signal is weak and noise is high, your edge gets buried.
If your signal is strong and noise is low, you can extract alpha with confidence.
In trading, SNR is like trying to hear a whisper in a hurricane. The whisper is your alpha. The hurricane is the market.
█ Why SNR Matters (More Than Sharpe, More Than Accuracy)
Most strategies die not because they’re logically flawed — but because they’re trying to extract signal in a low SNR environment.
Financial markets are dominated by noise.
The real edge (if it exists) is usually tiny and fleeting.
Even strong-looking backtests can be false positives created by fitting noise.
Every quant failure story you’ve ever heard — overfitting, false discoveries, bad AI models — starts with misunderstanding the signal-to-noise ratio.
█ SNR in the Age of AI
Machine learning struggles in markets because:
Most market data has very low SNR
The signal changes over time (nonstationarity)
AI is powerful enough to learn anything — including pure noise
This means unless you’re careful, your AI will confidently “discover” patterns that have no predictive value whatsoever.
Smart quants don’t just train models. They fight for SNR — every input, feature, and label is scrutinized through this lens.
█ How to Measure It (Sharpe, t-stat, IC)
You can estimate a strategy’s SNR with:
Sharpe Ratio: Signal = mean return, Noise = volatility
t-Statistic: Measures how confident you are that signal ≠ 0
Information Coefficient (IC): Correlation between forecast and realized return
👉 A high Sharpe or t-stat suggests strong signal vs noise
👉 A low value means your “edge” might just be noise in disguise
█ Real-World SNR: Why It's So Low in Markets
The average daily return of SPX is ~0.03%
The daily standard deviation is ~1%
That's signal-to-noise of 1:30 — and that's for the entire market, not a niche alpha.
Now imagine what it looks like for your scalping strategy, your RSI tweak, or your AI momentum model.
This is why most trading signals don’t survive live markets — the noise is just too loud.
█ How to Build Strategies With Higher SNR
To survive as a trader, you must engineer around low SNR. Here's how:
1. Combine signals
One weak signal = low SNR
100 uncorrelated weak signals = high aggregate SNR
2. Filter noise before acting
Use volatility filters, regime detection, thresholds
Trade only when signal strength exceeds noise level
3. Test over longer horizons
Short-term = more noise
Long-term = signal has more time to emerge
4. Avoid excessive optimization
Every parameter you tweak risks modeling noise
Simpler systems = less overfit = better SNR integrity
5. Validate rigorously
Walk-forward, OOS testing, bootstrapping — treat your model like it’s guilty until proven innocent
█ Low SNR = High Uncertainty
In low-SNR environments:
Alpha takes years to confirm (t-stat grows slowly)
Backtests are unreliable (lucky noise often looks like skill)
Drawdowns happen randomly (even good strategies get wrecked short-term)
This is why experience, skepticism, and humility matter more than flashy charts.
If your signal isn’t strong enough to consistently rise above noise, it doesn’t matter how elegant it looks.
█ Overfitting Is What Happens When You Fit the Noise
If you’ve read Why Your Backtest Lies , you already know the dangers of overfitting — when a strategy is tuned too perfectly to historical data and fails the moment it meets reality.
⚪ Here’s the deeper truth:
Overfitting is the natural consequence of working in a low signal-to-noise environment.
When markets are 95% noise and you optimize until everything looks perfect?
You're not discovering a signal. You're just fitting past randomness — noise that will never repeat the same way again.
❝ The more you optimize in a low-SNR environment, the more confident you become in something that isn’t real. ❞
This is why so many “flawless” backtests collapse in live trading. Because they never captured signal — they captured noise.
█ Final Word
Quant trading isn’t about who can code the most indicators or build the deepest neural nets.
It’s about who truly understands this:
❝ In a world full of noise, only the most disciplined signal survives. ❞
Before you build your next model, launch your next strategy, or chase your next setup…
Ask this:
❝ Am I trading signal — or am I trading noise? ❞
If you don’t know the answer, you're probably doing the latter.
-----------------
Disclaimer
The content provided in my scripts, indicators, ideas, algorithms, and systems is for educational and informational purposes only. It does not constitute financial advice, investment recommendations, or a solicitation to buy or sell any financial instruments. I will not accept liability for any loss or damage, including without limitation any loss of profit, which may arise directly or indirectly from the use of or reliance on such information.
All investments involve risk, and the past performance of a security, industry, sector, market, financial product, trading strategy, backtest, or individual's trading does not guarantee future results or returns. Investors are fully responsible for any investment decisions they make. Such decisions should be based solely on an evaluation of their financial circumstances, investment objectives, risk tolerance, and liquidity needs.


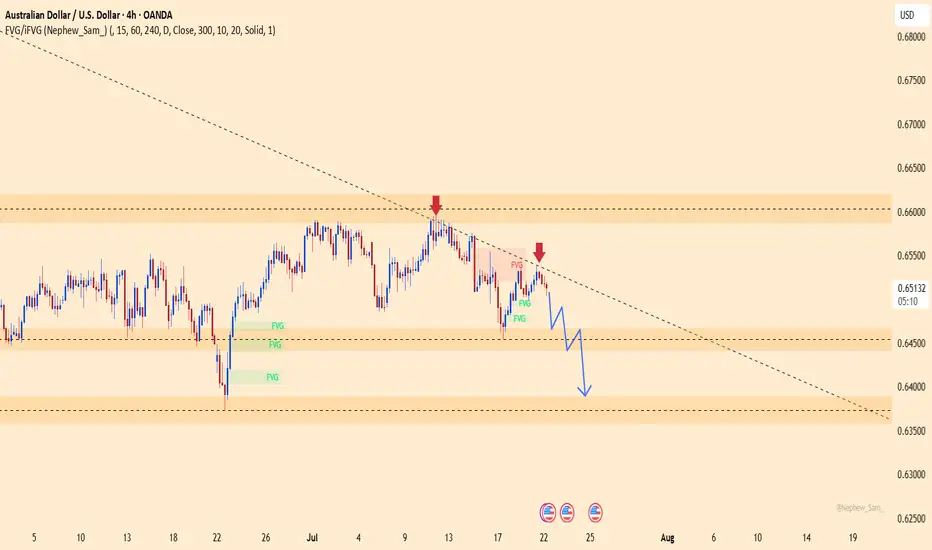
AUDUSD – Sellers taking over, the drop is on!This pair just got slapped hard at the descending trendline, right as it hit a familiar resistance zone. No more doubts – buyers are losing steam, and sellers are waiting to strike.
Market sentiment from Down Under is shaking, with weak economic signals piling up. Meanwhile, the mighty U.S. dollar is reclaiming the spotlight after gold’s flashy surge. The tide has turned!
Unless a miracle shows up, AUDUSD is set to dive deeper – and this is the perfect stage for traders who thrive on strong downtrends.
Sellers are in position – are you ready to join the ride?
AUDUSD Bullish Breakout!
HI,Traders !
#AUDUSD is trading in a strong
Uptrend and the price made a
Bullish breakout of the key
Horizontal level of 0.65829
So we are bullish biased
And we will be expecting a
Further bullish move up !
Comment and subscribe to help us grow !

BUY AUDUSD 24.7.2025Confluence order: BUY at H1~M15
Type of order: Limit order
Reason:
- The price breakout H4 (the last top) confirming the uptrend.
- M15~FIBO 0,5-0,618 (same position)
Note:
- Management of money carefully at the price of sub key M15 (0,65944)
Set up entry:
- Entry buy at 0,65823
- SL at 0,65741
- TP1: 0,65944
- TP2: 0,66064
Trading Method: Price action (No indicator, only trend and candles)

AUDUSDContinuation to the upside on Aussie to Dollar, bias is to pull up to the next resistance zone.watch out for price reaction

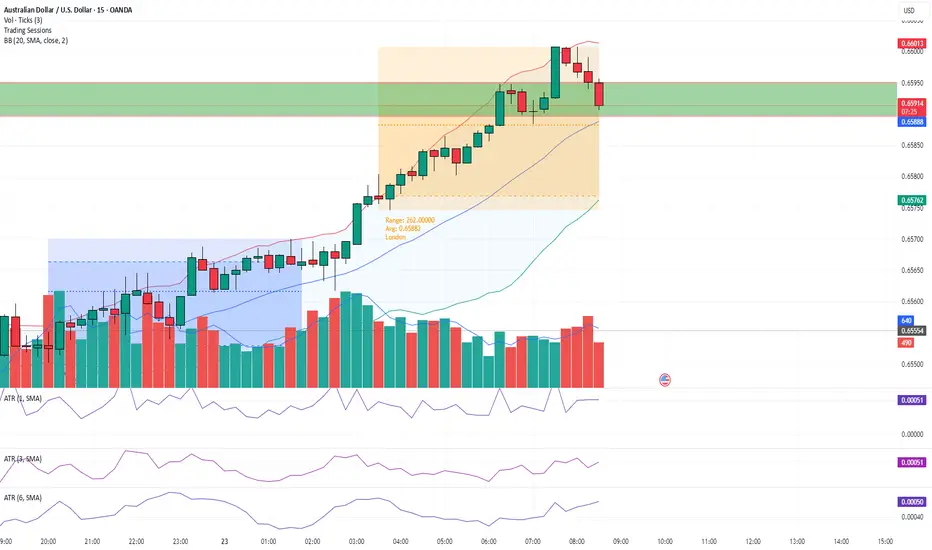
breakout idea1. Day high break
2. retest
3. ATR is increasing
4. price already return to bb
5. Planning to go long.
6. Waiting for confirmation candle
thanks
AUS/USD Long/Buy setting upLooking at AUS/USD for a potential Buy setting up on the Daily and 4 hr.
EMA has lined up in the correct stacking order.
An upward trend can be observed. The 20 has crossed over the 50.
We are starting a new Cycle 1 on the upward so I will wait for the pull back to the 20MA which will form the Cycle 2 then wait for the new Cycle 1 on the upward to start again before I buy in.

AUD/USD 2H – Price Action Buy SetupAfter a strong bullish push, price pulled back into a previous demand zone near 0.65000, where buyers had clearly stepped in before.
The previous resistance around 0.6510 was broken and now appears to be acting as support — a classic sign of a break and retest.
The current bullish rejection candle near the zone confirms buying interest.
✅ Entry: Around 0.6500
❌ Stop Loss: Below the recent low / demand zone (~0.6485)
🎯 Take Profit: 0.6550 and 0.6567 (previous swing high
Price is now forming higher lows and pushing upward — watching for continuation toward the next resistance.
#AUDUSD #PriceAction #BreakAndRetest #ForexSetup #SupportResistance #TrendContinuation #ForexAnalysis
AUDUSD H1 I Bullish Bounce off the 50% FibBased on the H1 chart analysis, the price is approaching our buy entry level at 0.6494, a pullback support that aligns with the 50% Fib retracement.
Our take profit is set at 0.6538, an overlap resistance.
The stop loss is placed at 0.673, a pullback support.
High Risk Investment Warning
Trading Forex/CFDs on margin carries a high level of risk and may not be suitable for all investors. Leverage can work against you.
Stratos Markets Limited (tradu.com ):
CFDs are complex instruments and come with a high risk of losing money rapidly due to leverage. 66% of retail investor accounts lose money when trading CFDs with this provider. You should consider whether you understand how CFDs work and whether you can afford to take the high risk of losing your money.
Stratos Europe Ltd (tradu.com ):
CFDs are complex instruments and come with a high risk of losing money rapidly due to leverage. 66% of retail investor accounts lose money when trading CFDs with this provider. You should consider whether you understand how CFDs work and whether you can afford to take the high risk of losing your money.
Stratos Global LLC (tradu.com ):
Losses can exceed deposits.
Please be advised that the information presented on TradingView is provided to Tradu (‘Company’, ‘we’) by a third-party provider (‘TFA Global Pte Ltd’). Please be reminded that you are solely responsible for the trading decisions on your account. There is a very high degree of risk involved in trading. Any information and/or content is intended entirely for research, educational and informational purposes only and does not constitute investment or consultation advice or investment strategy. The information is not tailored to the investment needs of any specific person and therefore does not involve a consideration of any of the investment objectives, financial situation or needs of any viewer that may receive it. Kindly also note that past performance is not a reliable indicator of future results. Actual results may differ materially from those anticipated in forward-looking or past performance statements. We assume no liability as to the accuracy or completeness of any of the information and/or content provided herein and the Company cannot be held responsible for any omission, mistake nor for any loss or damage including without limitation to any loss of profit which may arise from reliance on any information supplied by TFA Global Pte Ltd.
The speaker(s) is neither an employee, agent nor representative of Tradu and is therefore acting independently. The opinions given are their own, constitute general market commentary, and do not constitute the opinion or advice of Tradu or any form of personal or investment advice. Tradu neither endorses nor guarantees offerings of third-party speakers, nor is Tradu responsible for the content, veracity or opinions of third-party speakers, presenters or participants.

AUDUSD Q3 | D21 | W30 | Y25📊AUDUSD Q3 | D21 | W30 | Y25
Daily Forecast 🔍📅
Here’s a short diagnosis of the current chart setup 🧠📈
Higher time frame order blocks have been identified — these are our patient points of interest 🎯🧭.
It’s crucial to wait for a confirmed break of structure 🧱✅ before forming a directional bias.
This keeps us disciplined and aligned with what price action is truly telling us.
📈 Risk Management Protocols
🔑 Core principles:
Max 1% risk per trade
Only execute at pre-identified levels
Use alerts, not emotion
Stick to your RR plan — minimum 1:2
🧠 You’re not paid for how many trades you take, you’re paid for how well you manage risk.
🧠 Weekly FRGNT Insight
"Trade what the market gives, not what your ego wants."
Stay mechanical. Stay focused. Let the probabilities work.
FRGNT 📊

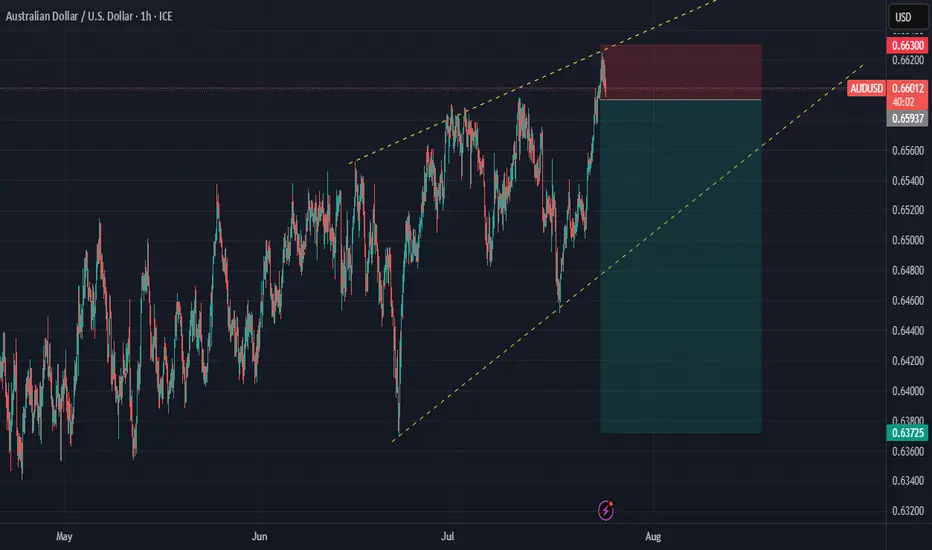
AUDUSD – a rebound from the bottom, ready to break free?After a strong bounce off the ascending trendline, AUDUSD is climbing decisively, clearing out multiple FVG zones on its way toward the key resistance near 0.66300. The bullish structure is intact, and buyers are clearly in control.
News backing the move:
– U.S. S&P Global PMI just came in below expectations, slowing the USD.
– China – Australia’s major trading partner – is signaling fresh stimulus, giving AUD an indirect boost.
If price reaches the 0.66300 zone without strong rejection, this could trigger a breakout that sets the stage for a new rally in August.
Caution: A USD rebound from this week’s data could briefly slow AUDUSD. But for now, the bulls are driving!

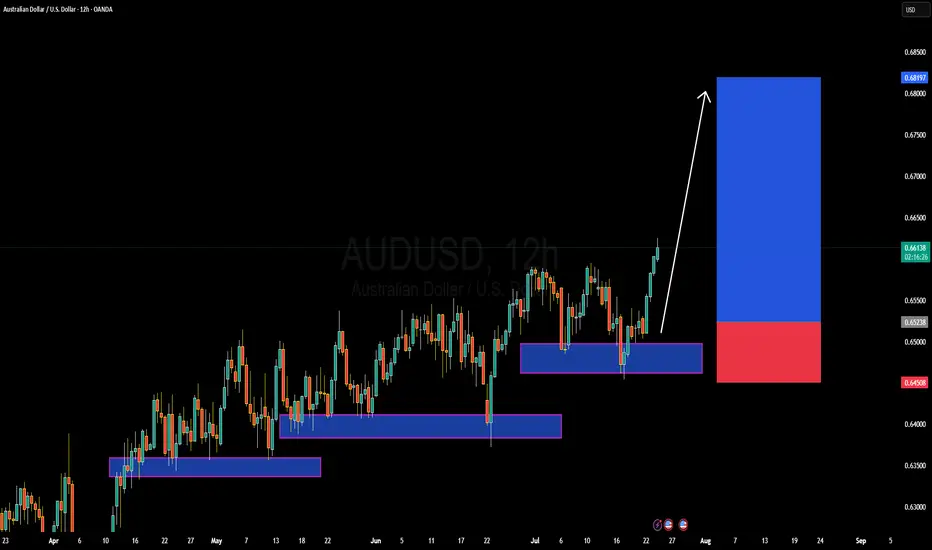
AUDUSD Forming Strong Bullish MomentumAUDUSD is currently showing strong bullish momentum, confirming a key breakout from recent consolidation. After multiple rejections at support zones, price action has now surged through previous resistance levels around 0.6600, signaling a bullish trend continuation. As seen on the 12H chart, the pair is respecting a series of higher lows and forming a clean ascending structure, with a fresh impulse wave now aiming toward the 0.6800–0.6820 target zone.
On the fundamental front, the Australian dollar is gaining strength as recent macro data supports a more optimistic economic outlook. Australia’s labor market remains tight, and inflation prints have come in hotter than expected, increasing speculation that the RBA may maintain a hawkish tone. Meanwhile, the US dollar is under pressure as markets continue to price in a potential Fed rate cut in the coming months, especially amid signs of slowing economic momentum and easing CPI. This divergence is helping AUDUSD push higher.
Technically, buyers are clearly in control. Each dip into demand zones has been aggressively bought, and the current price action confirms continuation. The recent break above 0.6600 is a significant technical development, and as long as price holds above the 0.6520–0.6500 support zone, I expect the pair to grind higher toward 0.6819 and beyond. Risk-reward remains favorable for buyers with a clear bullish structure intact.
With strong bullish confluence both fundamentally and technically, AUDUSD offers a high-probability long opportunity. I’ll be looking for continuation setups on lower timeframes while managing risk below key support. The trend is your friend here—stay with the bulls as the market positions ahead of upcoming US economic releases.
AUDUSD Q3 | D23 | W30 | Y25📊AUDUSD Q3 | D23 | W30 | Y25
Daily Forecast🔍📅
Here’s a short diagnosis of the current chart setup 🧠📈
Higher time frame order blocks have been identified — these are our patient points of interest 🎯🧭.
It’s crucial to wait for a confirmed break of structure 🧱✅ before forming a directional bias.
This keeps us disciplined and aligned with what price action is truly telling us.
📈 Risk Management Protocols
🔑 Core principles:
Max 1% risk per trade
Only execute at pre-identified levels
Use alerts, not emotion
Stick to your RR plan — minimum 1:2
🧠 You’re not paid for how many trades you take, you’re paid for how well you manage risk.
🧠 Weekly FRGNT Insight
"Trade what the market gives, not what your ego wants."
Stay mechanical. Stay focused. Let the probabilities work.
FRGNT

AUD/USD – 15m Demand📊 Trade Breakdown:
Pair: AUD/USD
Timeframe: 15 Minute
Bias: Bullish
Type: Demand Zone Rejection
Entry: 0.65264
Stop Loss: 0.65186
Take Profit: 0.65570
Risk-to-Reward: ~3R
⸻
📌 Key Confluences:
• Clean 15m demand zone formed after a sharp impulse move
• Strong bullish engulfing candle from demand
• Liquidity sweep to the left prior to demand forming
• Structure shift with higher highs and higher lows
• Previous resistance flipped to support at entry zone
• AUD strength showing on intraday sentiment across multiple pairs
⸻
⚙️ Trade Setup:
Entered long after price tapped into the refined 15m demand zone and printed a bullish rejection wick. SL placed just below the zone to avoid noise. TP set near a prior 15m supply area / liquidity sweep zone.
I’m watching for continuation on the next 15m-1h candle closures. If price breaks above 0.6544, expecting follow-through to 0.6557+.
⸻
🧠 Mindset:
Stayed patient waiting for price to come to me. No FOMO. Clear invalidation and clean R:R. Confidence in the setup due to structure, confluences, and reaction off the zone. Trusting the process and letting the trade breathe.
Trade Simple, Live Lavish

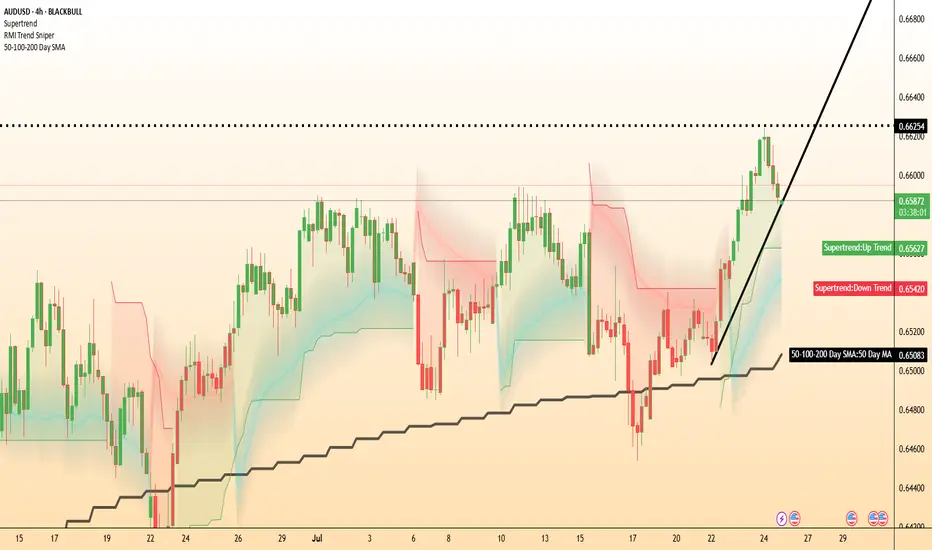
AUD/USD tests uptrend as Trump targets Powell at Fed siteThe US dollar is trading mixed after President Trump made a rare appearance at the Federal Reserve’s renovation site, in an attempt to distract from you know what.
While the visit had no formal policy announcements, Trump did try to further undermine Chair Jerome Powell by erroneously claiming the renovation cost had blown out to 3.1 billion by adding the cost of a building finished 5 years ago.
Meanwhile, AUD/USD could be of the most interest. Traders might like to watch to see if it can hold its uptrend after its downside breakout from yesterday. AUD/USD remains potentially supported above its 50-DMA, with momentum pointing to potential further upside beyond 0.6625.
AUDUSD InsightWelcome to all our subscribers!
Please share your personal opinions in the comments. Don't forget to like and subscribe!
Key Points
- Former U.S. Treasury Secretary Scott Bessent stated regarding Fed Chair Powell, “There is nothing that would make me say he should step down immediately,” — a remark that stands in contrast to previous comments made by former President Trump and his close aides.
- On U.S.-China trade negotiations, Secretary Bessent mentioned, “We will meet with Chinese officials in Stockholm on Monday and Tuesday to discuss extending the trade truce deadline.”
- Goldman Sachs has projected the U.S. growth rate this year at 1.1%. In a report, Jan Hatzius, Chief Economist at Goldman Sachs, estimated the probability of a U.S. recession at 30%, which is double the normal level.
Major Economic Events This Week
+ July 24: ECB Interest Rate Decision
AUDUSD Chart Analysis
The pair continues a gentle upward trend within its channel. As previously anticipated, a long-term rise toward the 0.69000 level is expected. However, resistance is still observed around the 0.66000 level. A breakout above this zone could lead to a swift rise toward 0.67000. Still, there is minor resistance near 0.67000, which may temporarily limit upward momentum. A slight pullback may occur before another upward move resumes.
