AUDUSDPullback to the support zone,
Test of the trend line
Possible continuation of growth after accumulation.
Best regards EXCAVO
_____________________
Disclosure: I am part of Trade Nation's Influencer program and receive a monthly fee for using their TradingView charts in my analysis.
AUDUSD trade ideas

AUDUSD Breakdown Incoming? Major Supply Zone Rejection + 3 Key LAUD/USD just got rejected hard from a major supply zone (0.6450–0.6415), as shown by the visible range and supply indicators (LuxAlgo). Price failed to hold above 0.6415 and has now broken below minor support at 0.6408.
Why this matters:
Strong supply zone at the top indicates aggressive sellers.
Volume Profile shows heavy activity around 0.6408 — now turning into resistance.
We’re seeing bearish momentum, and three key demand zones below could be the next targets:
Key Bearish Targets:
1. 0.6221 – Past consolidation & breakout level.
2. 0.6013 – Major demand + volume cluster.
3. 0.5900 – Monthly low and long-term demand zone.
Bearish Outlook: If momentum holds below 0.6408, expect downside acceleration. Confirmation comes with a close below 0.6221. A clean break here opens the door to a 200+ pip move toward 0.6013.
How I'm trading it:
Short bias under 0.6415
TP1: 0.6220
TP2: 0.6015
SL: 0.6450 (above supply)
News to Watch: Upcoming AUD employment and CPI data could spike volatility. Stay alert.
Do you think AUDUSD hits 0.60 next? Comment below!
#AUDUSD #Forex #SupplyAndDemand #LuxAlgo #Trading #TechnicalAnalysis #Breakdown #PriceAction #VolumeProfile

AUDUSD BEARISH?I want to see price come back to the -OB and with some confirmation, i expect a sell off from that zone. WHAT ARE YOUR THOUGHTS?

AUD/USD Inflation Data Crucial for RBA Decision. Key Supply ZoneThe AUD/USD exchange rate is approaching a key supply zone on the weekly chart, a region where significant long positions are concentrated. This presents a potential reversal point for the currency pair. Adding to the market's focus is the imminent release of Australia's inflation data on Wednesday. This report will be crucial in shaping expectations for the Reserve Bank of Australia's (RBA) next policy move. Market forecasts generally point towards a 25-basis-point interest rate cut in May, a decision likely driven by concerns over the potential economic fallout from recently imposed US tariffs. The upcoming inflation data will be closely scrutinized to confirm or challenge these anticipated policy adjustments. The confluence of technical analysis (the supply zone) and macroeconomic factors (the inflation report and RBA considerations) makes this a potentially pivotal week for AUD/USD.
✅ Please share your thoughts about AUD/USD in the comments section below and HIT LIKE if you appreciate my analysis. Don't forget to FOLLOW ME; you will help us a lot with this small contribution.

Australian Droller, AUD USD and LL to LH. You're referring to AUD/USD forming a Lower Low (LL) followed by a Lower High (LH) — a classic bearish market structure.

AUD USD and HH to LH.Your message indicates that AUD/USD (Australian Dollar vs. US Dollar) is showing a transition from a Higher High (HH) to a Lower High (LH) — a potentially bearish shift in market structure.

AUD/USD Looks Set for a PullbackThe V-bottom on AUD/USD certainly delivered for bulls, considering its low was printed amid a flurry of panicked headlines with the Aussie was on the brink of falling below 59c. But we're yet to see a pullback, even though it has been teasing one for a few weeks.
But given AUD/USD formed its most bearish day since April 4 on Wednesday, with a bearish engulfing candle which saw a false break of 65c before closing beneath its 200-day SMA, perhaps a pullback is imminent.
Also note the bearish divergence on the RSI (2).
Bears could seek to fade into moves towards the 200-day SMA, and retain a bearish bias while prices remain beneath Wednesday's high. A retest of the April VPOC at 0.6371 seems feasible, and a break beneath the 0.6344 low assumes a much larger correction is underway.
Matt Simpson, Market Analyst at City Index and Forex.com

Potential bearish drop?The Aussie (AUD/USD0 is rising towards the pivot which is a pullback resistance and could reverse to the 1st support that aligns with the 161.8% Fibonacci extension.
Pivot: 0.6446
1st Support: 0.6393
1st Resistance: 0.6468
Risk Warning:
Trading Forex and CFDs carries a high level of risk to your capital and you should only trade with money you can afford to lose. Trading Forex and CFDs may not be suitable for all investors, so please ensure that you fully understand the risks involved and seek independent advice if necessary.
Disclaimer:
The above opinions given constitute general market commentary, and do not constitute the opinion or advice of IC Markets or any form of personal or investment advice.
Any opinions, news, research, analyses, prices, other information, or links to third-party sites contained on this website are provided on an "as-is" basis, are intended only to be informative, is not an advice nor a recommendation, nor research, or a record of our trading prices, or an offer of, or solicitation for a transaction in any financial instrument and thus should not be treated as such. The information provided does not involve any specific investment objectives, financial situation and needs of any specific person who may receive it. Please be aware, that past performance is not a reliable indicator of future performance and/or results. Past Performance or Forward-looking scenarios based upon the reasonable beliefs of the third-party provider are not a guarantee of future performance. Actual results may differ materially from those anticipated in forward-looking or past performance statements. IC Markets makes no representation or warranty and assumes no liability as to the accuracy or completeness of the information provided, nor any loss arising from any investment based on a recommendation, forecast or any information supplied by any third-party.

Bearish drop for the Aussie?The price is rising towards the resistance level which is a pullback resistance that is slightly above the 23.6% Fibonacci retracement and could drop from this level to our take profit.
Entry: 0.6468
Why we like it:
There is a pullback resistance level that is slightly above the 23.6% Fibonacci retracement.
Stop loss: 0.6487
Why we like it:
There is a pullback resistance level that lines up with the 61.8% Fibonacci retracement.
Take profit: 0.6433
Why we like it:
There is an overlap support level that is slightly below the 50% Fibonacci retracement.
Enjoying your TradingView experience? Review us!
Please be advised that the information presented on TradingView is provided to Vantage (‘Vantage Global Limited’, ‘we’) by a third-party provider (‘Everest Fortune Group’). Please be reminded that you are solely responsible for the trading decisions on your account. There is a very high degree of risk involved in trading. Any information and/or content is intended entirely for research, educational and informational purposes only and does not constitute investment or consultation advice or investment strategy. The information is not tailored to the investment needs of any specific person and therefore does not involve a consideration of any of the investment objectives, financial situation or needs of any viewer that may receive it. Kindly also note that past performance is not a reliable indicator of future results. Actual results may differ materially from those anticipated in forward-looking or past performance statements. We assume no liability as to the accuracy or completeness of any of the information and/or content provided herein and the Company cannot be held responsible for any omission, mistake nor for any loss or damage including without limitation to any loss of profit which may arise from reliance on any information supplied by Everest Fortune Group.

AUDUSD Technical & Order Flow AnalysisOur analysis is based on multi-timeframe top-down analysis & fundamental analysis.
Based on our view, the price will fall to the monthly level.
DISCLAIMER: This analysis can change anytime without notice and is only for assisting traders in making independent investment decisions. Please note that this is a prediction, and I have no reason to act on it, and neither should you.
Please support our analysis with a boost or comment!

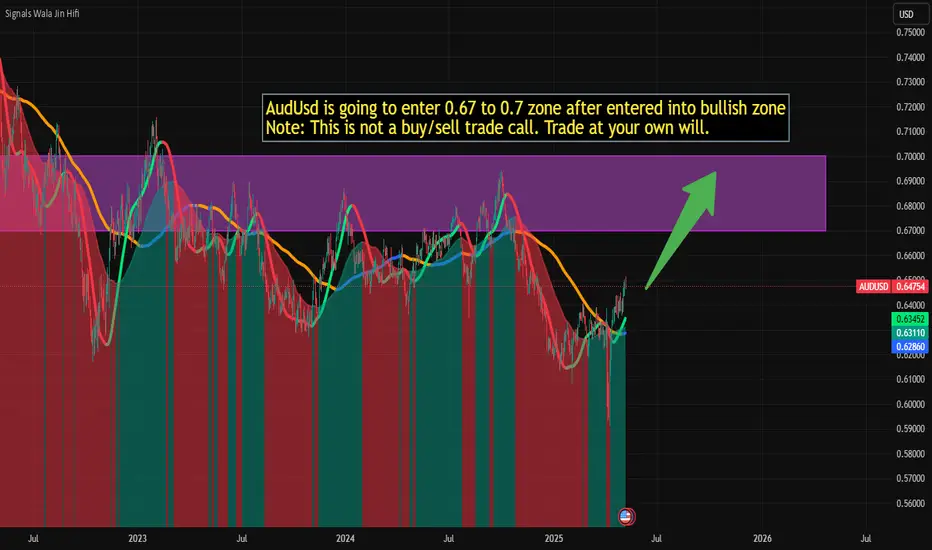
AudUsd is going to 0.67 to 0.7 zoneAudUsd is going to enter 0.67 to 0.7 zone after entered into bullish zone
Note: This is not a buy/sell trade call. Trade at your own will.
AUDUSD – Buy Limit Setup (Intraday Idea)Expires: 08/05/2025 06:00
Trade Summary
Type: Buy Limit
Entry: 0.6450
Target: 0.6510
Stop Loss: 0.6435
Risk/Reward Ratio: ~4:1
Duration: Intraday
Technical View
Medium-term bias remains bullish, suggesting the overall trend supports higher prices.
We anticipate a temporary dip, offering an opportunity to enter at more favourable levels.
Bespoke support at 0.6450 aligns with the Buy Limit entry, providing a strong technical foundation.
Despite some bearish divergence, short-term corrections are expected to be limited.
A move above 0.6500 may reaffirm the bullish momentum.
Upcoming US Events to Watch
07/05 15:30: EIA Weekly Petroleum Status Report
07/05 19:00: U.S. Interest Rate Decision
Key Technical Levels
Support: 0.6450 / 0.6430 / 0.6405
Resistance: 0.6500 / 0.6530 / 0.6550
Disclosure: I am part of Trade Nation's Influencer program and receive a monthly fee for using their TradingView charts in my analysis.

Bearish Look for potential Reversal bearish candlestick formation upon the retest of daily supply zone.

Aussie H1 | Approaching a pullback supportThe Aussie (AUD/USD) is falling towards a pullback support and could potentially bounce off this level to climb higher.
Buy entry is at 0.6469 which is a pullback support that aligns close to the 23.6% Fibonacci retracement.
Stop loss is at 0.6430 which is a level that lies underneath an overlap support and the 50.0% Fibonacci retracement.
Take profit is at 0.6507 which is a swing-high resistance.
High Risk Investment Warning
Trading Forex/CFDs on margin carries a high level of risk and may not be suitable for all investors. Leverage can work against you.
Stratos Markets Limited (tradu.com):
CFDs are complex instruments and come with a high risk of losing money rapidly due to leverage. 63% of retail investor accounts lose money when trading CFDs with this provider. You should consider whether you understand how CFDs work and whether you can afford to take the high risk of losing your money.
Stratos Europe Ltd (tradu.com):
CFDs are complex instruments and come with a high risk of losing money rapidly due to leverage. 63% of retail investor accounts lose money when trading CFDs with this provider. You should consider whether you understand how CFDs work and whether you can afford to take the high risk of losing your money.
Stratos Global LLC (tradu.com):
Losses can exceed deposits.
Please be advised that the information presented on TradingView is provided to Tradu (‘Company’, ‘we’) by a third-party provider (‘TFA Global Pte Ltd’). Please be reminded that you are solely responsible for the trading decisions on your account. There is a very high degree of risk involved in trading. Any information and/or content is intended entirely for research, educational and informational purposes only and does not constitute investment or consultation advice or investment strategy. The information is not tailored to the investment needs of any specific person and therefore does not involve a consideration of any of the investment objectives, financial situation or needs of any viewer that may receive it. Kindly also note that past performance is not a reliable indicator of future results. Actual results may differ materially from those anticipated in forward-looking or past performance statements. We assume no liability as to the accuracy or completeness of any of the information and/or content provided herein and the Company cannot be held responsible for any omission, mistake nor for any loss or damage including without limitation to any loss of profit which may arise from reliance on any information supplied by TFA Global Pte Ltd.
The speaker(s) is neither an employee, agent nor representative of Tradu and is therefore acting independently. The opinions given are their own, constitute general market commentary, and do not constitute the opinion or advice of Tradu or any form of personal or investment advice. Tradu neither endorses nor guarantees offerings of third-party speakers, nor is Tradu responsible for the content, veracity or opinions of third-party speakers, presenters or participants.

AUDUSD: Bullish Reaction from Key Fibonacci Support AUDUSD breaks double bottom on the 38.2% Fibonacci retracement
🚀Price has formed a double bottom around the 38.2% Fibonacci retracement level. The 15:00 candle confirms bullish strength. If this structure holds, the price may extend to retest yesterday’s high.
🔍 Trade Setup
Entry limit:
Stop Loss:
Take Profit:
Risk/Reward: ≈
💬 What do you think?
Are you also long on AUDUSD?
Share your thoughts in the comments 👇

Lingrid | AUDUSD bullish CONTINUATION PotentialFX:AUDUSD is currently respecting an upward trendline after bouncing off the local bottom. The pair broke out of the consolidation range and formed a higher high, signaling bullish continuation. A pullback is now testing the trendline and support zone — a bounce here could lead to a rally toward the upper resistance.
📌 Key Levels
Support Zone: 0.64391 – 0.64450
Breakout Target: 0.65000
Invalidation Level: 0.63934 (below trendline + structural break)
⚠️ Risks
Failure to hold the support zone could lead to a trendline break and deeper drop toward 0.63934.
Low liquidity or fakeouts near 0.65000 may trigger reversals.
Unexpected macro news may distort short-term technicals.
Traders, if you liked this idea or if you have your own opinion about it, write in the comments. I will be glad 👩💻

AUDUSD LONG FORECAST Q2 W19 D7 Y25AUDUSD LONG FORECAST Q2 W19 D7 Y25
Professional Risk Managers👋
Welcome back to another FRGNT chart update📈
Diving into some Forex setups using predominantly higher time frame order blocks alongside confirmation breaks of structure.
Let’s see what price action is telling us today!
💡Here are some trade confluences📝
✅Weekly 50 EMA
✅Intraday 15' order block
✅Tokyo ranges to be filled
✅Intraday bullish breaks of structure to be confirmed
🔑 Remember, to participate in trading comes always with a degree of risk, therefore as professional risk managers it remains vital that we stick to our risk management plan as well as our trading strategies.
📈The rest, we leave to the balance of probabilities.
💡Fail to plan. Plan to fail.
🏆It has always been that simple.
❤️Good luck with your trading journey, I shall see you at the very top.
🎯Trade consistent, FRGNT X

Bearish reversal for the Aussie?The price is rising towards the pivot and could reverse to the 1st support.
Pivot: 0.6536
1st Support: 0.6407
1st Resistance: 0.6619
Risk Warning:
Trading Forex and CFDs carries a high level of risk to your capital and you should only trade with money you can afford to lose. Trading Forex and CFDs may not be suitable for all investors, so please ensure that you fully understand the risks involved and seek independent advice if necessary.
Disclaimer:
The above opinions given constitute general market commentary, and do not constitute the opinion or advice of IC Markets or any form of personal or investment advice.
Any opinions, news, research, analyses, prices, other information, or links to third-party sites contained on this website are provided on an "as-is" basis, are intended only to be informative, is not an advice nor a recommendation, nor research, or a record of our trading prices, or an offer of, or solicitation for a transaction in any financial instrument and thus should not be treated as such. The information provided does not involve any specific investment objectives, financial situation and needs of any specific person who may receive it. Please be aware, that past performance is not a reliable indicator of future performance and/or results. Past Performance or Forward-looking scenarios based upon the reasonable beliefs of the third-party provider are not a guarantee of future performance. Actual results may differ materially from those anticipated in forward-looking or past performance statements. IC Markets makes no representation or warranty and assumes no liability as to the accuracy or completeness of the information provided, nor any loss arising from any investment based on a recommendation, forecast or any information supplied by any third-party.

AUD_USD WILL KEEP GROWING|LONG|
✅AUD_USD is trading in an
Uptrend and the pair made a
Bullish breakout of the key
Horizontal level of 0.6450
And the breakout
Is confirmed so as the pair keeps
Growing we will be expecting a
Further bullish move up
LONG🚀
✅Like and subscribe to never miss a new idea!✅
Disclosure: I am part of Trade Nation's Influencer program and receive a monthly fee for using their TradingView charts in my analysis.

AUDUSD READY TO LAUNCH: HTF Bias + OB + FVG + PRIME SETUPBias:
We’re operating within a clear bullish higher time frame bias, confirmed by previous swing structure and continuous displacement to the upside. Price has consistently made higher highs and higher lows on the 4H and Daily chart.
Entry Zone:
✅ 4H Fair Value Gap (FVG) — a clean imbalance from prior bullish displacement. Price has now retraced into this inefficiency, a key area where smart money typically looks to re-accumulate.
✅ 1H Order Block (OB) — precisely overlapping the 4H FVG, strengthening the setup. This is the last bearish candle before the bullish move that created a market structure shift, now acting as a support zone.
This dual confluence—FVG + OB at a retracement level—marks a premium setup.

MarketBreakdown | AUDUSD, EURAUD, US100, CHFJPY
Here are the updates & outlook for multiple instruments in my watch list.
1️⃣ #AUDUSD daily time frame 🇦🇺🇺🇸
The pair has completed a bullish accumulation and violated
a resistance line of a horizontal range on a daily.
A new higher high higher close confirms a strong bullish sentiment
and a highly probably continuation of an uptrend.
2️⃣ #EURAUD daily time frame 🇪🇺🇦🇺
The price has recently violated a significant daily support cluster.
After a breakout, the price dropped but did not manage
to reach any important demand zone so far.
The closest one is based on 1.742 level.
It will most likely be the next goal for the sellers.
3️⃣ #US100 daily time frame
The market is currently retesting a recently broken
massive daily demand cluster.
I believe that the growth will resume soon
and the price will reach 20300.
4️⃣ #CHFJPY daily time frame 🇨🇭🇯🇵
The pair is currently testing a critical contracting demand
zone based on a rising trend line and a horizontal support.
I will expect a strong bullish reaction to that.
Do you agree with my market breakdown?
❤️Please, support my work with like, thank you!❤️
I am part of Trade Nation's Influencer program and receive a monthly fee for using their TradingView charts in my analysis.

AUD USDAUD/USD – Re-entry Setup in Play
Price has offered a re-entry opportunity at 0.64653, aligning with previous structure. This setup remains valid for those who were stopped out or took partial profits earlier.
Entry: 0.64653
Stop Loss: 0.65144
Target: 0.62680
We're watching for a continuation lower as long as price remains below 0.65144. Maintain risk management.
#AUDUSD #forex #priceaction #technicalanalysis

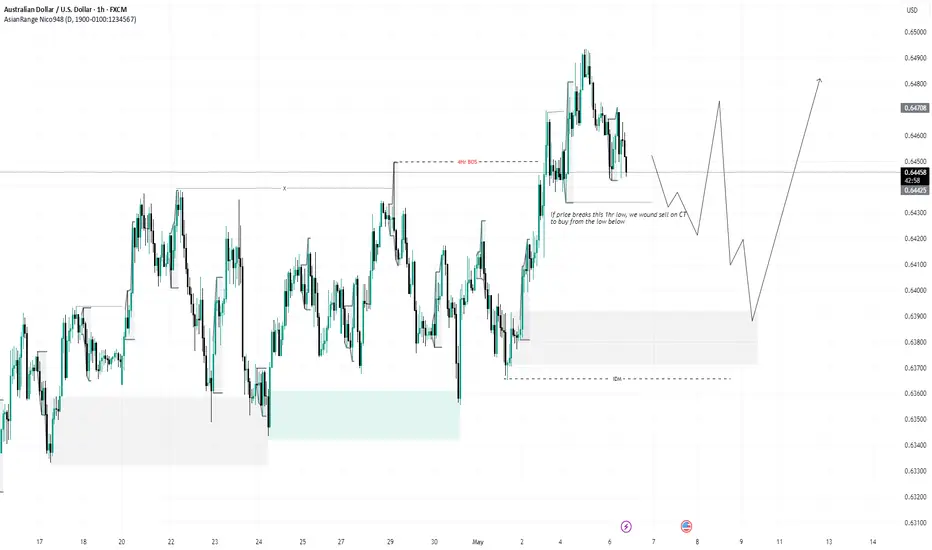
my View on AUWHAT I THOUGHT ON AUDUSD
Showed two opportunity here, A sell to the downside (counter Trend) to mitigate the demand level below to continue the original trend.
Let me know what you think guys.