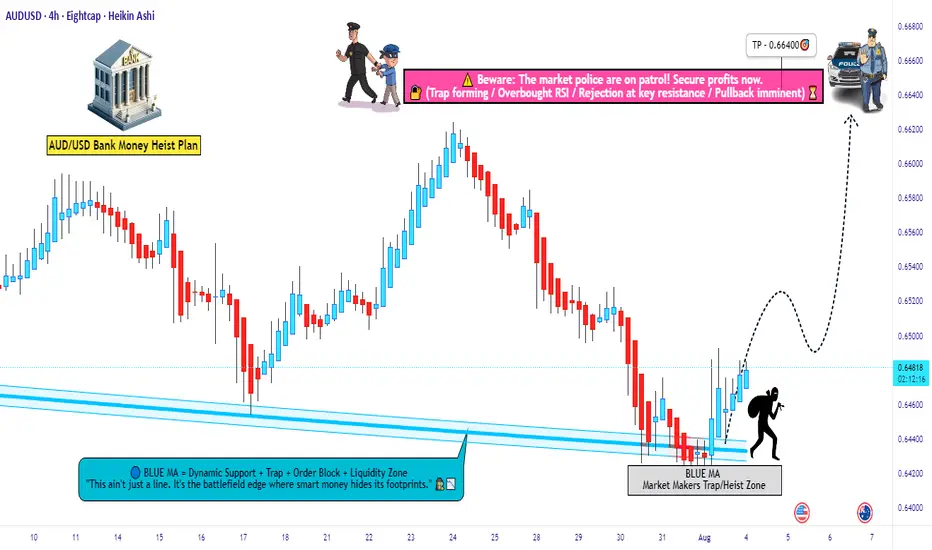
Ready for the Aussie Heist? Is This the Perfect Entry?🚨💰 - "The Aussie Vault Raid: Bullish Robbery in Progress!" 💰🚨
AUD/USD Forex Trade Idea (Thief Style Swing/Day Plan)
📈🔥 Designed for Thief Traders, Market Robbers & Money Makers Worldwide 🤑🐱👤💸
🌍 Hello Global Robbers!
🌟 Hola! Ola! Bonjour! Hallo! Salaam! Konnichiwa! 🌟
Welcome to another bold heist plan from the Thief Trading Crew. This one’s a high-stakes raid on the AUD/USD — "The Aussie" — using our signature Thief Trading Style, combining raw technical setups with real macro/fundamental edge. We're eyeing the Bullish Vault Breakout, so tighten up your gloves — it’s time to rob smart, not hard.
🔓💸 ENTRY PLAN – “The Vault is Unlocked!”
Grab the bullish loot at any valid price zone — but here’s how real thieves move:
📍 Recommended Entry Style:
Use Buy Limit Orders near local swing lows, demand zones, or key pullback entries on the 15m to 30m chart.
Execute DCA (Dollar Cost Averaging) / Layered Orders for more precision.
Align with your MA lines & candle structures for max confirmation.
🛑 STOP LOSS – “Escape Route Secured”
📍 SL hidden beneath recent swing lows below MA (on 4H):
🎯 Suggested Level: 0.64170
💡 Custom-fit your SL based on:
Trade size
Number of active positions
Account risk strategy
🎯 PROFIT TARGET – “Cash Out Before the Cops Show!”
🏴☠️ Take-Profit Zone: 0.66400
This is our bullish breakout reward zone — a high-value zone where profit meets safety.
🔍 MARKET OUTLOOK – "Cops Are Watching, but We're Ahead..."
📈 The AUD/USD market is flashing bullish momentum, supported by:
✅ Risk sentiment flow
✅ US Dollar weakness and rate expectations
✅ Intermarket signals from commodities (Gold/Iron)
✅ Positive macro positioning from smart money (via COT)
✅ Technical demand forming reversal patterns from oversold zones
📎 For a deeper breakdown —
📰 Fundamentals | COT Reports | Sentiment | Intermarket Analysis — Check Klick 🔗
⚠️ THIEF ALERT – “Avoid Sirens. Watch the News.”
Stay out of trouble by following these protocols during major news events:
🚫 Don’t enter trades blindly before/after big news
📍 Use trailing stops to protect gains
🔄 Adjust SL/TP if price nears breakout points during volatility
💥 SUPPORT THE CREW – “Smash That Boost Button!”
Love the plan? Then Boost this chart to show love for the Thief Trading Movement.
Every like, comment, and boost adds power to our robbery network across the globe. 🌍❤️💰
⚖️ DISCLAIMER – “Not Financial Advice, Just Thief Vibes”
📌 This analysis is for educational and entertainment purposes only.
📌 Trade at your own risk and always do your own analysis.
📌 Market moves fast — stay sharp, stay stealthy.
**🎭 See you at the next heist.
Until then, trade rich. Rob wise.
Thief Trader out. 🐱👤💰📉📈**
AUDUSD trade ideas
Potential bullish reversal?The Aussie (AUD/USD) has bounced off the pivot, which is a swing low support, and could rise to the 1st resistance, which acts as a pullback resistance.
Pivot: 0.6502
1st Support: 0.6468
1st Resistance: 0.6558
Risk Warning:
Trading Forex and CFDs carries a high level of risk to your capital and you should only trade with money you can afford to lose. Trading Forex and CFDs may not be suitable for all investors, so please ensure that you fully understand the risks involved and seek independent advice if necessary.
Disclaimer:
The above opinions given constitute general market commentary, and do not constitute the opinion or advice of IC Markets or any form of personal or investment advice.
Any opinions, news, research, analyses, prices, other information, or links to third-party sites contained on this website are provided on an "as-is" basis, are intended only to be informative, is not an advice nor a recommendation, nor research, or a record of our trading prices, or an offer of, or solicitation for a transaction in any financial instrument and thus should not be treated as such. The information provided does not involve any specific investment objectives, financial situation and needs of any specific person who may receive it. Please be aware, that past performance is not a reliable indicator of future performance and/or results. Past Performance or Forward-looking scenarios based upon the reasonable beliefs of the third-party provider are not a guarantee of future performance. Actual results may differ materially from those anticipated in forward-looking or past performance statements. IC Markets makes no representation or warranty and assumes no liability as to the accuracy or completeness of the information provided, nor any loss arising from any investment based on a recommendation, forecast or any information supplied by any third-party.

Potential bearish drop?The Aussie (AUD/USD) is rising toward the resistance level, which is a pullback resistance that is slightly above the 23.6% Fibonacci retracement and could reverse from this level to our take profit.
Entry: 0.6532
Why we like it:
There is a pullback resistance that is slightly above the 23.6% Fibonacci retracement.
Stop loss: 0.6580
Why we like it:
There is a pullback resistance that is slightly above the 61.8% Fibonacci retracement.
Take profit: 0.6467
Why we like it:
There is a swing low support.
Enjoying your TradingView experience? Review us!
TradingView (www.tradingview.com)
Please be advised that the information presented on TradingView is provided to Vantage (‘Vantage Global Limited’, ‘we’) by a third-party provider (‘Everest Fortune Group’). Please be reminded that you are solely responsible for the trading decisions on your account. There is a very high degree of risk involved in trading. Any information and/or content is intended entirely for research, educational and informational purposes only and does not constitute investment or consultation advice or investment strategy. The information is not tailored to the investment needs of any specific person and therefore does not involve a consideration of any of the investment objectives, financial situation or needs of any viewer that may receive it. Kindly also note that past performance is not a reliable indicator of future results. Actual results may differ materially from those anticipated in forward-looking or past performance statements. We assume no liability as to the accuracy or completeness of any of the information and/or content provided herein and the Company cannot be held responsible for any omission, mistake nor for any loss or damage including without limitation to any loss of profit which may arise from reliance on any information supplied by Everest Fortune Group.

AUDUSD – Plan Ready for Both ScenariosWe're patiently waiting for price to reach our key zone. If we get a valid sell signal, we’ll take the short.
But if the market breaks above this level with strength and gives us a clean pullback, we’re ready to go long.
No guessing. No hoping. Just reacting to what the market shows us.
📌 Discipline over prediction.

AUDUSD – DAILY FORECAST Q3 | W31 | D29 | Y25📊 AUDUSD – DAILY FORECAST
Q3 | W31 | D29 | Y25
Daily Forecast 🔍📅
Here’s a short diagnosis of the current chart setup 🧠📈
Higher time frame order blocks have been identified — these are our patient points of interest 🎯🧭.
It’s crucial to wait for a confirmed break of structure 🧱✅ before forming a directional bias.
This keeps us disciplined and aligned with what price action is truly telling us.
📈 Risk Management Protocols
🔑 Core principles:
Max 1% risk per trade
Only execute at pre-identified levels
Use alerts, not emotion
Stick to your RR plan — minimum 1:2
🧠 You’re not paid for how many trades you take, you’re paid for how well you manage risk.
🧠 Weekly FRGNT Insight
"Trade what the market gives, not what your ego wants."
Stay mechanical. Stay focused. Let the probabilities work.
FX:AUDUSD

AUDUSD Technical & Order Flow AnalysisOur analysis is based on a multi-timeframe top-down approach and fundamental analysis.
Based on our assessment, the price is expected to return to the monthly level.
DISCLAIMER: This analysis may change at any time without notice and is solely intended to assist traders in making independent investment decisions. Please note that this is a prediction, and I have no obligation to act on it, nor should you.
Please support our analysis with a boost or comment!

UADUSD 60/15 Pullback ShortOverall down trend. Saw previous session closing away from P profile, Looking for a retest on current session POC, and continue for bearish momentum.
Two possible pullbacks on sell zones above. React as accordingly.

AUDUSD – DAILY FORECAST Q3 | W32 | D4 | Y25📊 AUDUSD – DAILY FORECAST
Q3 | W32 | D4 | Y25
Daily Forecast 🔍📅
Here’s a short diagnosis of the current chart setup 🧠📈
Higher time frame order blocks have been identified — these are our patient points of interest 🎯🧭.
It’s crucial to wait for a confirmed break of structure 🧱✅ before forming a directional bias.
This keeps us disciplined and aligned with what price action is truly telling us.
📈 Risk Management Protocols
🔑 Core principles:
Max 1% risk per trade
Only execute at pre-identified levels
Use alerts, not emotion
Stick to your RR plan — minimum 1:2
🧠 You’re not paid for how many trades you take, you’re paid for how well you manage risk.
🧠 Weekly FRGNT Insight
"Trade what the market gives, not what your ego wants."
Stay mechanical. Stay focused. Let the probabilities work.
FX:AUDUSD

AUDUSD longs!!!Hello everyone
My bias towards AUDUSD is looking bullish and these are my reasons on why.
1. Price started to consolidate between 14/05/25 to 23/06/25 which caused price to take out EQL'S and create a CHOCH to the upside.
2. Price has than created many more consolidation patterns followed by EQL's raids as well.
3. I am hoping price will return back to my 4hr demand zone to go long again.
Looking for either market entry or buy limit not sure yet will find out as time goes by.

AUDUSD BUYBUY @0.64256
SL @0.64189
TP @0.64591
If SL hits by a candle sweep and closed above the entry level again buy....
And always risk 1%

AUDUSD Potential UpsidesHey Traders, in today's trading session we are monitoring AUDUSD for a buying opportunity around 0.64000 zone, AUDUSD is trading in an uptrend and currently is in a correction phase in which it is approaching the trend at 0.64000 support and resistance area.
Trade safe, Joe.

Daily AnalysisWe continue following our trade setup from Monday and looked into valid entries for the day

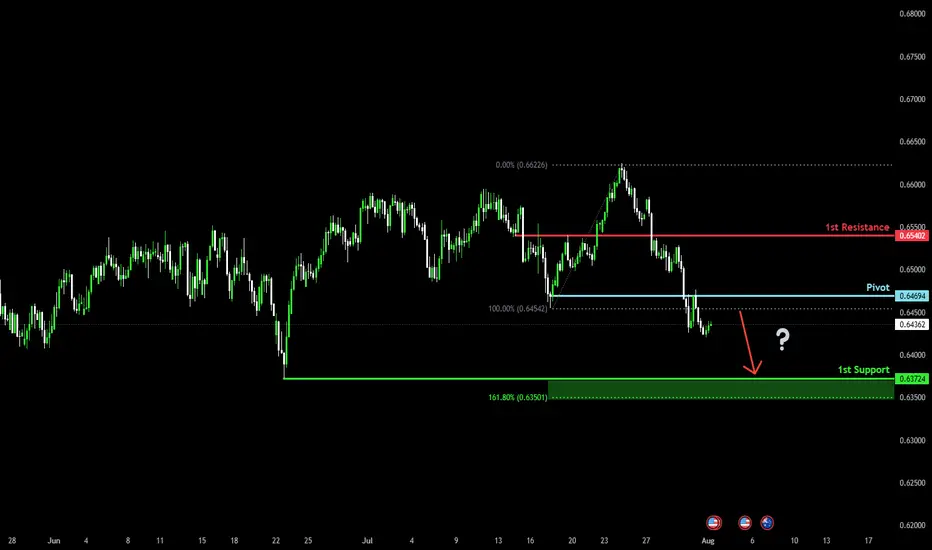
Could we see a further drop for the Aussie?The price has rejected off the pivot, which has been identified as a pullback resistance and could drop to the 1st support, which acts as a swing low support.
Pivot: 0.6469
1st Support: 0.6372
1st Resistance: 0.6540
Risk Warning:
Trading Forex and CFDs carries a high level of risk to your capital and you should only trade with money you can afford to lose. Trading Forex and CFDs may not be suitable for all investors, so please ensure that you fully understand the risks involved and seek independent advice if necessary.
Disclaimer:
The above opinions given constitute general market commentary, and do not constitute the opinion or advice of IC Markets or any form of personal or investment advice.
Any opinions, news, research, analyses, prices, other information, or links to third-party sites contained on this website are provided on an "as-is" basis, are intended only to be informative, is not an advice nor a recommendation, nor research, or a record of our trading prices, or an offer of, or solicitation for a transaction in any financial instrument and thus should not be treated as such. The information provided does not involve any specific investment objectives, financial situation and needs of any specific person who may receive it. Please be aware, that past performance is not a reliable indicator of future performance and/or results. Past Performance or Forward-looking scenarios based upon the reasonable beliefs of the third-party provider are not a guarantee of future performance. Actual results may differ materially from those anticipated in forward-looking or past performance statements. IC Markets makes no representation or warranty and assumes no liability as to the accuracy or completeness of the information provided, nor any loss arising from any investment based on a recommendation, forecast or any information supplied by any third-party.
AUDUSD Potential UpsidesHey Traders, in today's trading session we are monitoring AUDUSD for a buying opportunity around 0.64900 zone, AUDUSD is trading in an uptrend and currently is in a correction phase in which it is approaching the trend at 0.64900 support and resistance area.
Trade safe, Joe.

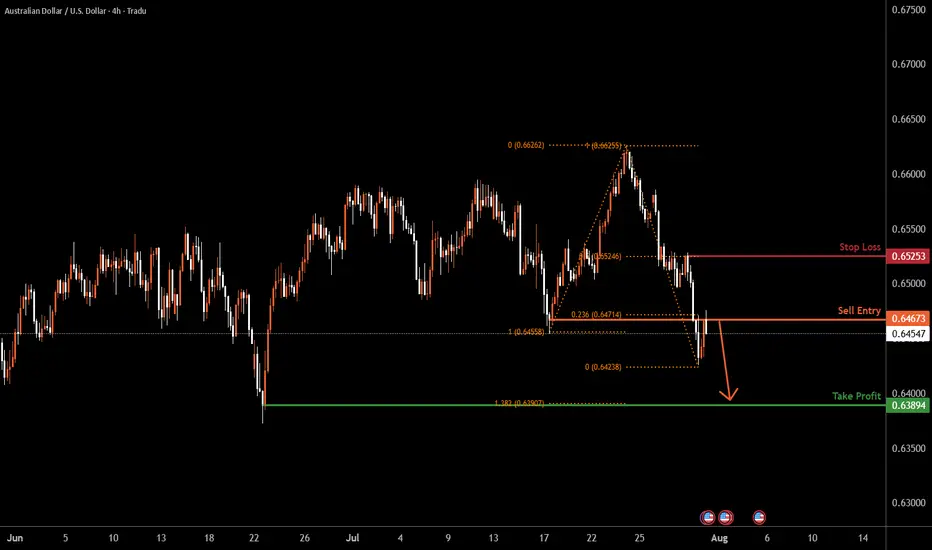
Aussie H4 | Bearish reversal off pullback resistanceBased on the H4 chart analysis, we can see that the price is reacting off the sell entry, which acts as a pullback resistance that aligns with the 23.6% Fibonacci retracement and could drop lower from this level.
Sell entry is at 0.6467, which is a pullback resistance that lines up with the 23.6% Fibonacci retracement.
Stop loss is at 0.6525, which is a pullback resistance that aligns with the 50% Fibonacci retracement.
Take profit is at 0.6389, which is a swing low support that aligns with the 138.2% Fibonacci extension.
High Risk Investment Warning
Trading Forex/CFDs on margin carries a high level of risk and may not be suitable for all investors. Leverage can work against you.
Stratos Markets Limited (tradu.com ):
CFDs are complex instruments and come with a high risk of losing money rapidly due to leverage. 65% of retail investor accounts lose money when trading CFDs with this provider. You should consider whether you understand how CFDs work and whether you can afford to take the high risk of losing your money.
Stratos Europe Ltd (tradu.com ):
CFDs are complex instruments and come with a high risk of losing money rapidly due to leverage. 66% of retail investor accounts lose money when trading CFDs with this provider. You should consider whether you understand how CFDs work and whether you can afford to take the high risk of losing your money.
Stratos Global LLC (tradu.com ):
Losses can exceed deposits.
Please be advised that the information presented on TradingView is provided to Tradu (‘Company’, ‘we’) by a third-party provider (‘TFA Global Pte Ltd’). Please be reminded that you are solely responsible for the trading decisions on your account. There is a very high degree of risk involved in trading. Any information and/or content is intended entirely for research, educational and informational purposes only and does not constitute investment or consultation advice or investment strategy. The information is not tailored to the investment needs of any specific person and therefore does not involve a consideration of any of the investment objectives, financial situation or needs of any viewer that may receive it. Kindly also note that past performance is not a reliable indicator of future results. Actual results may differ materially from those anticipated in forward-looking or past performance statements. We assume no liability as to the accuracy or completeness of any of the information and/or content provided herein and the Company cannot be held responsible for any omission, mistake nor for any loss or damage including without limitation to any loss of profit which may arise from reliance on any information supplied by TFA Global Pte Ltd.
The speaker(s) is neither an employee, agent nor representative of Tradu and is therefore acting independently. The opinions given are their own, constitute general market commentary, and do not constitute the opinion or advice of Tradu or any form of personal or investment advice. Tradu neither endorses nor guarantees offerings of third-party speakers, nor is Tradu responsible for the content, veracity or opinions of third-party speakers, presenters or participants.
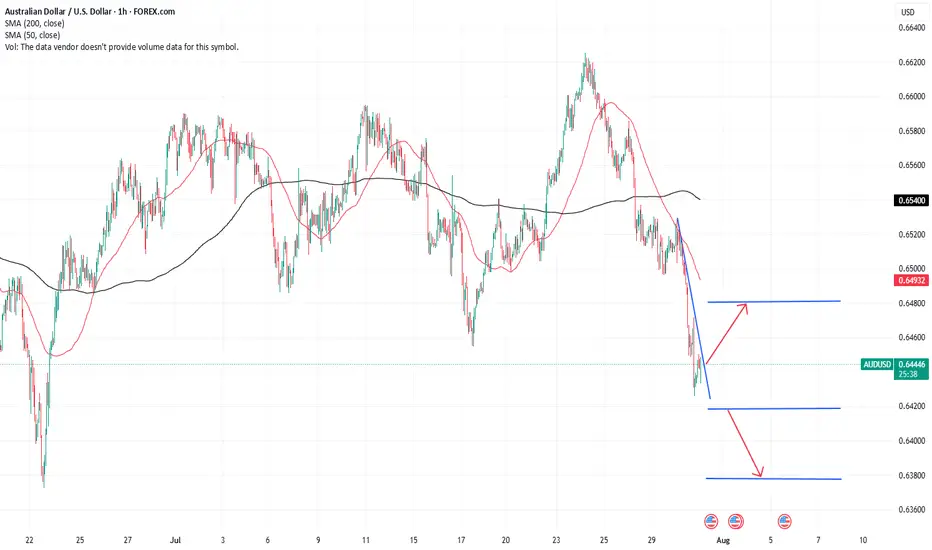
AUDUSD - Possible retracement/reversal to hourly 50 MA AUDUSD is making 5 week lows and is due for a retracement or possible reversal in a downtrend to a major Moving Average. Despite news of lowered interest rates reducing it's appeal, the market has likely already discounted it's lack of appeal into the recent decline.
Await confirmation of break of recent trendline as, given it's poor performance it could fall on lack of confidence to a major previous support level.
AUDUSD My Opinion! BUY!
My dear subscribers,
AUDUSD looks like it will make a good move, and here are the details:
The market is trading on 0.6455 pivot level.
Bias - Bullish
Technical Indicators: Both Super Trend & Pivot HL indicate a highly probable Bullish continuation.
Target - 0.6512
About Used Indicators:
The average true range (ATR) plays an important role in 'Supertrend' as the indicator uses ATR to calculate its value. The ATR indicator signals the degree of price volatility.
Disclosure: I am part of Trade Nation's Influencer program and receive a monthly fee for using their TradingView charts in my analysis.
———————————
WISH YOU ALL LUCK

AUD/USDThis is a trade setup for AUD/USD, based on volume and trend analysis.
Entry Price: 0.64230
Stop-Loss (SL): 0.64350
Take-Profit (TP): 0.64100
The trade is intended to be executed instantly at the mentioned price, in alignment with both volume behavior and the current trend direction.
Disclaimer: This setup is shared purely for backtesting purposes and to document trade ideas. It is not financial advice. Always perform your own analysis before making any trading decisions.

AUDUSD BUY SETUPAUDUSD is bullish on the daily timeframe and is currently retracing to continue buying. I want to see structural liquidity taken and tap my entry before continuing to the upside.

AUD/USD – Potential Bounce Buy SetupOANDA:AUDUSD
Timeframe: 30m
Type: Counter-trend / Bounce from Support
Risk Level: Medium to High
Possible Reward: 4+
🔹 Setup:
Price is testing the lower boundary of the recent support zone (0.6432 – 0.6420), aligning with the previous channel structure visible on the 8h chart. The descending move has shown initial signs of exhaustion, suggesting a potential bounce.
📈 Entry:
Current price zone 0.6432 – 0.6445
🎯 Targets (TP):
TP1: 0.64624
TP2: 0.64797
TP4: 0.65158
⛔ Stop Loss (SL):
0.64250 (below recent swing low and liquidity pool)
8H chart Overview:
Previous Position from top of Channel:
#AUDUSD #Forex #SmartMoney #PriceAction #MJTrading #ChartDesigner
Psychology Always Matters:

AUDUSD: Dropping To the Weekly FVG, As Expected!In this video, we will analyze the following FX market for July 31 - Aug 1st.
AUDUSD
Been waiting and watching for this move, and we've tracked it for weeks! It's happening now!
Look for it to continue until we reach the +FVG!
Enjoy!
May profits be upon you.
Leave any questions or comments in the comment section.
I appreciate any feedback from my viewers!
Like and/or subscribe if you want more accurate analysis.
Thank you so much!
Disclaimer:
I do not provide personal investment advice and I am not a qualified licensed investment advisor.
All information found here, including any ideas, opinions, views, predictions, forecasts, commentaries, suggestions, expressed or implied herein, are for informational, entertainment or educational purposes only and should not be construed as personal investment advice. While the information provided is believed to be accurate, it may include errors or inaccuracies.
I will not and cannot be held liable for any actions you take as a result of anything you read here.
Conduct your own due diligence, or consult a licensed financial advisor or broker before making any and all investment decisions. Any investments, trades, speculations, or decisions made on the basis of any information found on this channel, expressed or implied herein, are committed at your own risk, financial or otherwise.

AUDUSD Will Keep Falling!
HI,Traders !
#AUDUSD keeps falling down
And the pair made a strong
Bearish breakout of the key
Horizontal key level of 0.64796
And the breakout is confirmed
So we are bearish biased and
We will be expecting a further
Bearish move down !
Comment and subscribe to help us grow !

XAUUSD and AUDUSD Analysis todayHello traders, this is a complete multiple timeframe analysis of this pair. We see could find significant trading opportunities as per analysis upon price action confirmation we may take this trade. Smash the like button if you find value in this analysis and drop a comment if you have any questions or let me know which pair to cover in my next analysis
