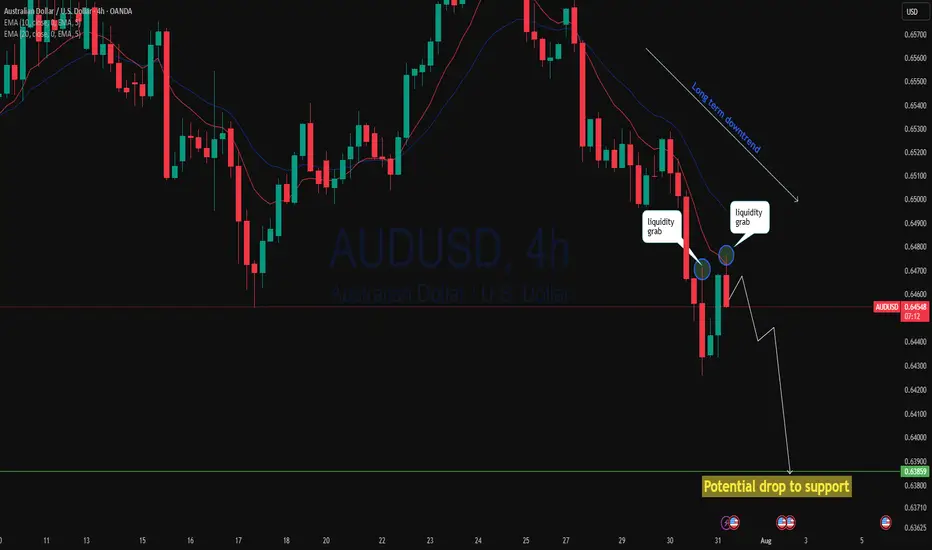
AUDUSD 2 step liquidity grab and drop?AUDUSD 4h has rejected twice from a key area after yesterday's massive breakdown with AUD negative data. Price has done a narrow pullback then this session is rejecting again with a stronger momentum could continue to drop to support. As 4h price action showing strong bearish move we may see continuation of the down trend!
AUDUSD trade ideas
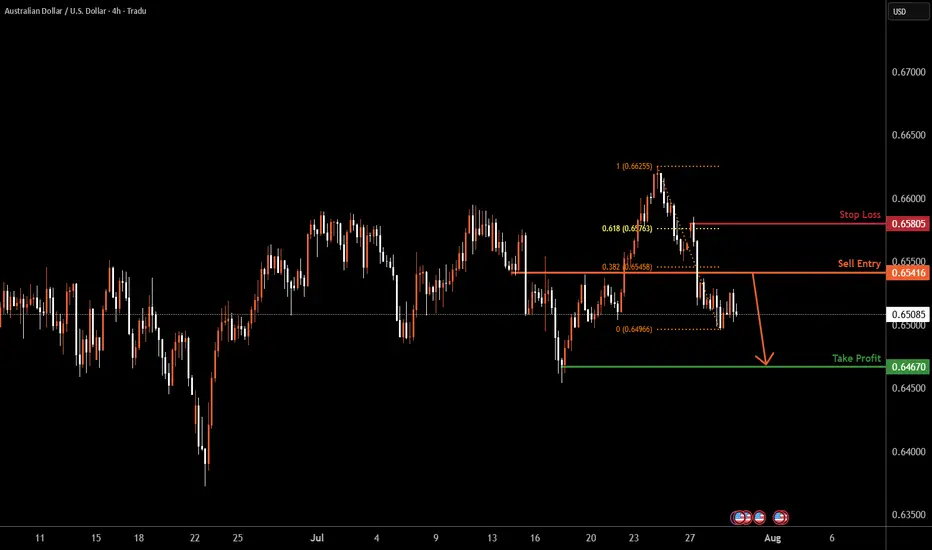
AUDUSD H4| Bearish reversal off 38.2% Fibonacci resistanceAussie (AUD/USD) is rising towards the sell entry, which is a pullback resistance that lines up with the 38.2% Fibonacci retracement and could reverse to the take profit.
Buy entry is at 0.6541, which is a pullback resistance that lines up with the 38.2% Fibonacci retracement.
Stop loss is at 0.6580, which is a pullback resistance that aligns with the 61.8% Fibonacci retracement.
Take profit is at 0.6467, which is a swing low support.
High Risk Investment Warning
Trading Forex/CFDs on margin carries a high level of risk and may not be suitable for all investors. Leverage can work against you.
Stratos Markets Limited (tradu.com ):
CFDs are complex instruments and come with a high risk of losing money rapidly due to leverage. 65% of retail investor accounts lose money when trading CFDs with this provider. You should consider whether you understand how CFDs work and whether you can afford to take the high risk of losing your money.
Stratos Europe Ltd (tradu.com ):
CFDs are complex instruments and come with a high risk of losing money rapidly due to leverage. 66% of retail investor accounts lose money when trading CFDs with this provider. You should consider whether you understand how CFDs work and whether you can afford to take the high risk of losing your money.
Stratos Global LLC (tradu.com ):
Losses can exceed deposits.
Please be advised that the information presented on TradingView is provided to Tradu (‘Company’, ‘we’) by a third-party provider (‘TFA Global Pte Ltd’). Please be reminded that you are solely responsible for the trading decisions on your account. There is a very high degree of risk involved in trading. Any information and/or content is intended entirely for research, educational and informational purposes only and does not constitute investment or consultation advice or investment strategy. The information is not tailored to the investment needs of any specific person and therefore does not involve a consideration of any of the investment objectives, financial situation or needs of any viewer that may receive it. Kindly also note that past performance is not a reliable indicator of future results. Actual results may differ materially from those anticipated in forward-looking or past performance statements. We assume no liability as to the accuracy or completeness of any of the information and/or content provided herein and the Company cannot be held responsible for any omission, mistake nor for any loss or damage including without limitation to any loss of profit which may arise from reliance on any information supplied by TFA Global Pte Ltd.
The speaker(s) is neither an employee, agent nor representative of Tradu and is therefore acting independently. The opinions given are their own, constitute general market commentary, and do not constitute the opinion or advice of Tradu or any form of personal or investment advice. Tradu neither endorses nor guarantees offerings of third-party speakers, nor is Tradu responsible for the content, veracity or opinions of third-party speakers, presenters or participants.
30.07.25 Morning ForecastPairs on Watch -
FX:AUDUSD
FX:NZDUSD
FX:EURUSD
A short overview of the instruments I am looking at for today, multi-timeframe analysis down to what I will be looking at for an entry. Enjoy!

AUDUSD FORECASTLooking into the AUDUSD today, the market is really looking Nice. Waiting for the market to reach at the area of focus. Looking to take as a sell limit order waiting for the price to Liquidate then taking after gaining volume and power to push to the downside, it gives me the high probability to looking into this pair.

AUDUSD InsightHello to all subscribers.
Please share your personal opinions in the comments. Don’t forget to like and subscribe!
Key Points
- According to the U.S. June Job Openings and Labor Turnover Survey (JOLTS), the seasonally adjusted number of job openings was 7.437 million, a decrease of 275,000 from the previous month, falling short of the market expectation of 7.55 million.
- During high-level talks between the U.S. and China held in Stockholm, Sweden, both sides reportedly agreed to extend the tariff suspension measure for an additional 90 days.
- While the Federal Reserve is expected to hold rates steady in the July FOMC meeting, there is growing anticipation for a dovish stance suggesting a possible rate cut in September.
This Week's Major Economic Events
+ July 30: Germany Q2 GDP, U.S. ADP Nonfarm Employment Change (July), U.S. Q2 GDP, Bank of Canada rate decision, FOMC meeting results announcement
+ July 31: Bank of Japan rate decision, Germany July Consumer Price Index (CPI), U.S. June Personal Consumption Expenditures (PCE) Price Index
+ August 1: Eurozone July CPI, U.S. July Nonfarm Payrolls, U.S. July Unemployment Rate
AUDUSD Chart Analysis
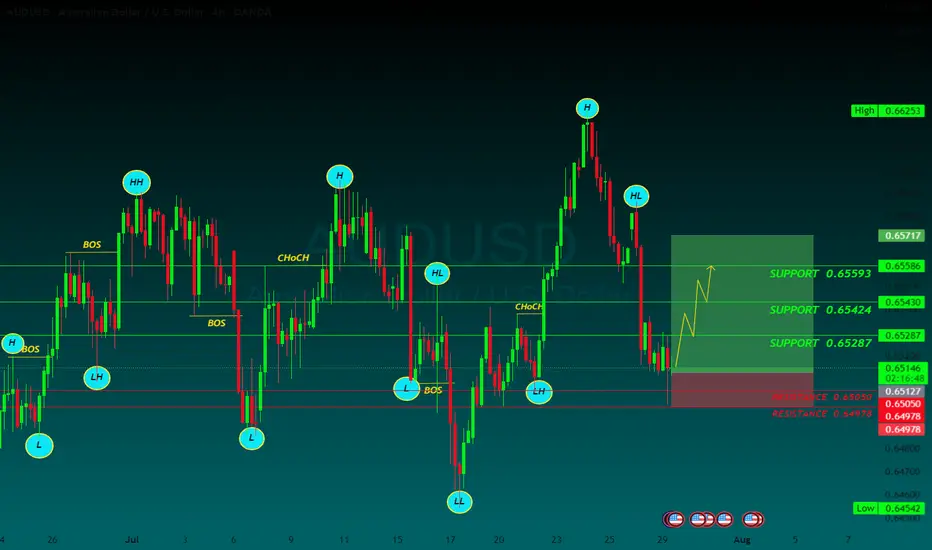
The pair recently climbed above the 0.66000 level but has since reversed, giving back gains. However, both higher highs and higher lows are being established, suggesting the current pullback is part of a gradual uptrend. A continued bullish outlook is expected over the long term, with a projected high around the 0.69000 level.

Surely the RBA Must Cut Rates Now?The RBA defied expectations of a cut in July, despite soft trimmed mean inflation figures in the monthly CPI report. The quarterly figures have now dropped, which I suspect leaves little wriggle room to hold at 2.85% in August. I 6ake a look at the quarterly and monthly inflation prints that matter, then wrap up on AUD/USD.
Matt Simpson, Market Analyst at City Index and Forex.com


Check the trend A triangle pattern is expected to form within the current support range. Then the start of an uptrend is likely. If the price breaks through the 78.6% level, a continuation of the correction and downtrend is possible.

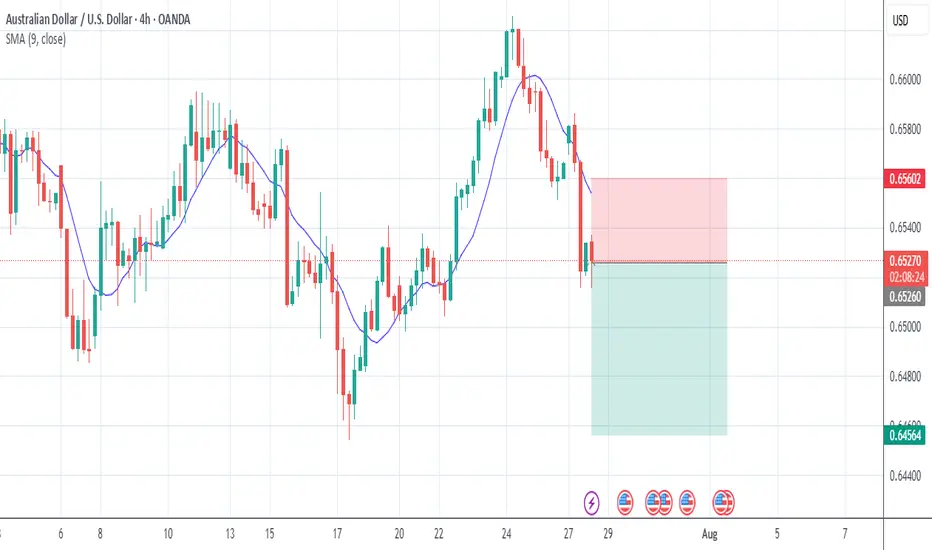
AUDUSD BUYThe AUD/USD pair is trading around 0.6520 on Tuesday. The daily chart’s technical analysis indicates a prevailing bullish bias as the pair remains within the ascending channel pattern. However, the 14-day Relative Strength Index (RSI) has moved below the 50 mark, indicating that a bearish bias is active. Additionally, the pair is positioned below the nine-day Exponential Moving Average (EMA), indicating that short-term price momentum is weaker.
The US and EU reached a framework trade agreement on Sunday that sets 15% tariffs on most European goods, taking effect on August 1. This deal has ended a months-long stand-off, per Bloomberg.
Traders keep their eyes on further developments in the US-China trade talks. The discussions are set to resume on Tuesday after top economic officials from both nations held over five hours of negotiations in Stockholm on Monday. The purpose of this meeting is to resolve ongoing disputes and extend their trade truce by another three months.
US Treasury Chief Scott Bessent met with China’s Vice Premier He Lifeng at Sweden’s Rosenbad government offices. The meeting comes ahead of an August 12 deadline to finalize a long-term tariff agreement with the Trump administration, building on preliminary deals reached in May and June that had helped ease tensions.
The US Federal Reserve (Fed) is widely expected to keep the benchmark interest rate steady between 4.25% and 4.50% at its July meeting. The FOMC press conference will be observed for any signs that rate cuts may start in September.
The Reserve Bank of Australia (RBA) is expected to closely watch the June labor force data and second-quarter inflation figures before deciding on a potential rate cut. Both the monthly and quarterly CPI reports are scheduled for release later this week.
SUPPORT 0.65593
SUPPORT 0.65424
SUPPORT 0.65593
RESISTSNCE 0.65050
RESISTANCE 0.64973
Potential BullsFrom the EW concepts, it looks like a w5 of a leading diagonal is the next print out on a D1 Time frame, and currently is a w4 correction.
By Harmonics, looks like a BAT Pattern finalising H1, and therefore looks like it's time to warm the engines of the chopper ready to fly. Until then we're expecting a bullish move.

audusd sell tradeThe Relative Strength Index (RSI) is showing a downward trend, indicating weakening momentum. Additionally, the Moving Average Convergence Divergence (MACD) is showing a bearish crossover, further supporting the potential for a downward move
AUDUSD ~ Real Time Elliott Wave UpdatesThis is an update of an AUDUSD chart I had previously posted. We can see that Wave B(Blue) confirms at the 161.8% Fib. level and then sells. Wave B(Blue) pushed a bit higher than I had previously thought, but all other analysis remains the same. The sentiment is a for a sell. Check my previous post for more analysis on this pair.

RBA poised to lower rates, Australian dollar in holding patternThe Australian dollar is coming off a strong week, gaining almost 1% against the US dollar. In Monday's European session, AUD/USD is almost unchanged at 0.6521.
The Reserve Bank of Australia is virtually certain to lower rates at Tuesday's meeting. This would be the third cut of 2025 and would lower the cash rate to 3.60%, its lowest level since April 2023. This indicates a gradual, cautious approach to lowering rates.
The RBA had a trick up its sleeve in July, when it opted to hold rates. The markets had widely expected a rate cut but the RBA said that it wanted to see additional inflation data before delivering a rate cut.
Inflation has been cooling, as CPI for the second quarter nudged down to 2.1% y/y, down from 2.4% in Q1. This strongly supports the case for a rate cut as CPI has fallen close to the lower band of the RBA's 2%-3% target. Core inflation has also been easing lower. As well, the labor market is showing signs of cooling and the central bank wants to avoid a sharp deterioration in employment data.
With today's move practically a given, investors will be looking for hints about further cuts. Governor Bullock has sounded cautious, noting that inflation remains sticky and there is continuing uncertainty over US tariffs.
Australian goods face a low 10% US tariff, which is not expected to have a significant impact on the economy. However, US tariffs on China, which is Australia's largest trading partner, could weigh on economic growth.
In the US, it's a very light calendar with no tier-1 events. On Tuesday, the US releases CPI for July, which is expected to tick up to 2.8% from 2.7% in June.
AUD/USD is testing support at 0.6414. Below, there is support at 0.6506
There is resistance at 0.6529 and 0.6536
AUDUSD – Bearish Scenario (USD ahead of CPI / PPI)Monthly: - Bearish – macro downtrend intact.
Weekly: - Bearish – price making lower highs and lower lows.
Daily: + Bullish retracement, but struggling to expand higher.
4H Context:
• Price inside descending regression channel, currently in premium zone.
• Overhead confluence: -FVG (0.65414 – 0.65511) and -BreakerBlock from prior bullish failure.
• Minor Buy Side Liquidity rests at 0.65414; possible draw before continuation lower.
Scenario Observation:
– Expectation is for price to draw towards Minor Buy Side Liquidity and tap into the -FVG / -BreakerBlock overlap.
– Monitor for rejection/displacement within this zone in agreement with monthly and weekly bias.
– Downside liquidity rests at 0.64190 (Sell Side) aligning with channel lower boundary.
– Invalidation if price closes decisively above 0.65669 on the 4H.


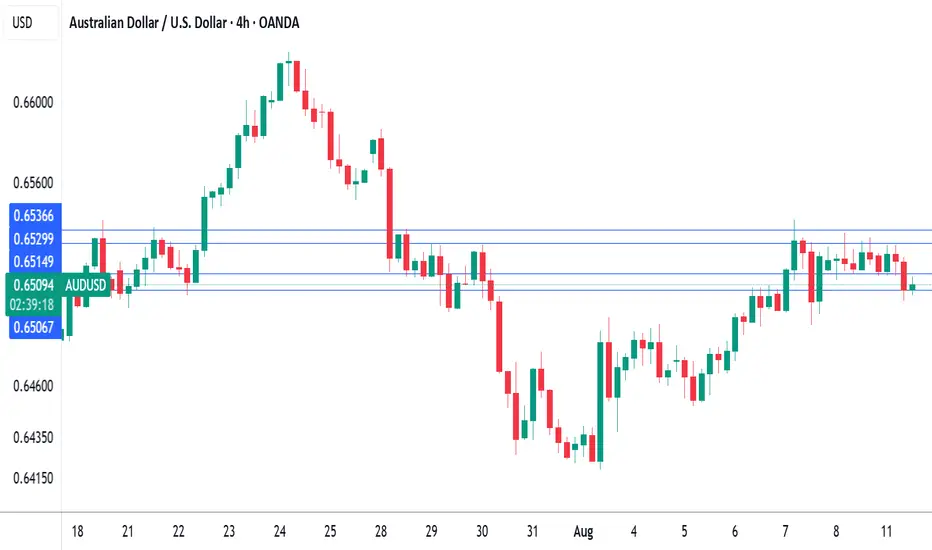
AUSDUSD 4Hour TF - August 10th ,2025🟦 AUDUSD 4H Analysis
📅 August 10, 2025
Top-Down Trend Bias:
• Monthly – Bearish
• Weekly – Bearish
• Daily – Bearish
• 4H – Bullish
AUDUSD is currently resting around our key zone at 0.6500 after a bullish push on the 4H. Higher timeframes remain bearish, making this a potential area for sellers to re-enter the market.
🔍 Key Zone: 0.6500
This level aligns with prior structure and could serve as a rejection point for either a bullish or bearish short term move.
✅ Scenario A: Bearish Continuation (Orange Path)
1.If price taps 0.6500 and rejects
2.Look for bearish confirmation (engulfing, LTF BOS, rejection wicks)
Target 1: 0.6350 support
This is the trend aligned setup and holds higher probability given the HTF bias.
⚠️ Scenario B: Bullish Breakout (Blue Path)
1.If price rejects 0.6500
2.Could open the door to 0.6585 resistance zone
3.Would indicate a stronger bullish correction within the broader downtrend
This path is counter-trend on HTFs and requires solid confirmation.
🧠 Final Notes
• Higher timeframe structure is bearish, so shorts are favored unless 0.6500 holds
• Patience is key let the level confirm before entering
• Manage risk carefully, especially on counter-trend setups

AUD/USD Pullback or Trap? Key Level in FocusPrice has slipped below the rising channel and is now pulling back to retest the breakdown area. This retest could decide the next move.
If buyers fail to step in here, and price gets rejected again, it may signal the start of a deeper correction. However, reclaiming the channel could flip the bias back to bullish.

AUD/USD - Full in depth breakdown (MUST READ) 📉 AUD/USD Multi-Timeframe Sell Setup – High Confidence Reversal
Pair: AUD/USD
Timeframes: Weekly / Daily / 1H
Bias: Bearish
Entry Zone: Supply Zone around 0.6700 - 0.6730
Target Zones:
🔹 TP1: 0.6520 (Mid-Range)
🔹 TP2: 0.6360 (Channel Support)
🔹 TP3: 0.6250 (Long-Term Demand Zone)
🧠 Technical Breakdown:
🔸 WEEKLY TIMEFRAME
✅ Long-Term Bearish Channel
Price is respecting a clearly defined descending channel.
This week’s price action has reacted perfectly from the upper boundary of that channel – rejecting continuation of bullish moves.
✅ Major Supply Zone Reaction
The most recent rejection aligns with a historically respected weekly supply zone.
Volume was introduced here in the past, suggesting institutional presence and high sell interest.
🔸 DAILY TIMEFRAME
✅ Daily Market Structure Shift
A confirmed daily break of structure (D-BOS) shows the bullish wave has lost steam.
Most recent rally into Supply 2 has been rejected, forming a lower high within the macro downtrend.
✅ Volume Profile Confluence
Volume is heaviest below current price, suggesting there’s little interest or imbalance left to fill above.
Current price sits in a low volume node, often leading to quick rejections and sell-offs.
✅ Supply Zone + 71% Premium Level
Price has tapped into the 71% Fib retracement level, aligning perfectly with:
Prior supply zones
EMA resistance
Volume-based rejections
🔸 1H TIMEFRAME
✅ CHoCH & i-BOS Confirming Reversal
Clear Change of Character (CHoCH) followed by internal Break of Structure (i-BOS) confirms lower timeframe bearish intent.
Price is currently forming a retracement leg, likely to pull back into supply for another sell.
✅ Bearish Schematic Playing Out
Expecting minor bullish pullback to retest broken structure before continuation into deeper targets.
Clean distribution phase completing before markdown.
📌 Sell Plan:
Sell Zone: 0.6700 – 0.6730 (supply + 71%)
Stop Loss: Above supply zone / channel high
Take Profits:
TP1: 0.6520 (fair value gap zone)
TP2: 0.6360 (channel low)
TP3: 0.6250 (major demand)
⚠️ Risk Management
Enter on lower timeframe confirmation (1H / 15M engulfing or BOS)
Trail stops as each BOS forms
Maintain R:R ≥ 1:3 for higher timeframes
🗓️ Market Outlook:
AUD/USD is aligning across all major timeframes for a high-probability bearish continuation. With structure shifted, supply respected, and volume confirming rejection, sellers are in clear control.
🔔 Follow for more SMC-based setups, clean structure trades, and multi-timeframe confluence strategies.

AUDUSD(20250807)Today's AnalysisMarket News:
Federal Reserve Chairman Neel Kashkari: A rate cut may be appropriate in the short term, and two rate cuts this year are reasonable. Trump: The new Fed governor will likely be temporary, and the appointment will be announced within 2-3 days.
Technical Analysis:
Today's Buy/Sell Levels:
0.6489
Support and Resistance Levels:
0.6538
0.6520
0.6508
0.6470
0.6458
0.6440
Trading Strategy:
If the price breaks above 0.6508, consider a buy entry, with the first target at 0.6520. If the price breaks below 0.6489, consider a sell entry, with the first target at 0.6470

AUDUSD - BullishAUDUSD is Bullish on Fundamental Bias and Seasonal aslo support long position. Divergence can also be observed on RSI.

AUDUSD Swing Trade Plan – 1H Time FrameThe pair is showing early signs of bullish structure with a clean higher low (HL) to higher high (HH) transition. An instant buy entry is considered valid based on the breakout above a key resistance zone.
🔹 Entry: Market Buy (Current Price ≈ 0.65038)
🔹 Stop Loss (SL): 0.64496
🔹 Take Profit (TP): 0.65523
📌 Structure Shift Noted
The break above prior highs confirms a market structure reversal with HL → HH → HH sequence. The bullish RSI divergence and sustained move above the EMA cluster further support upside momentum.
📍 Trade Rationale:
Price broke out of prior resistance and retested it as new support
RSI currently around 63, indicating strength without being overbought
Favorable risk-reward from current levels, targeting previous imbalance area at TP1
🧠 Plan: Monitor candle close above minor intraday range for continued bullish pressure. SL is placed below recent demand and last swing low for structural protection.
💡 Patience and discipline are key — watch how price behaves around the 0.652 zone before scaling in.

AUD/USD Long SetupMarket structure just flipped bullish after sweeping liquidity around the 0.64200 zone.
Entry triggered on bullish break & retest, aiming for 0.65290.
SL well-protected below recent low.
🧠 Smart money move or trap?
Let the market prove you right, not your emotions.
No PAIN | no GAIN. Let the market DECIDE.

AUDUSD?
Hi,
Few days of rejection high 0.64900
Hope it breaks out 0.65000
Anything below 0.64800
I don't think, will get it at another round
All the best
Not a guru
