AUDUSD trade ideas
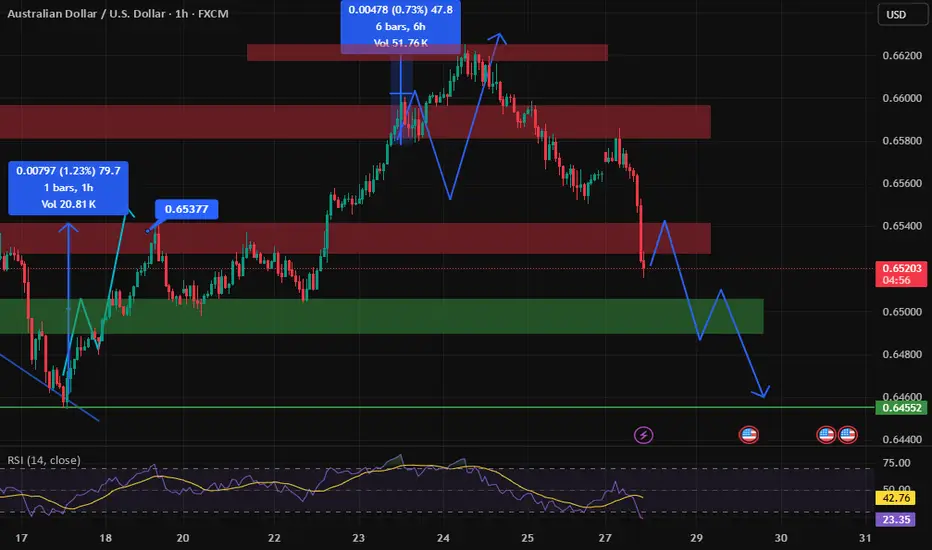
AUDUSD 60/15 Pullback ShortSeeing the market shifted from bull to bear. Looking for a pullback and short.
There is strong sell above, possible to quick probe that then drop.
Monitor.

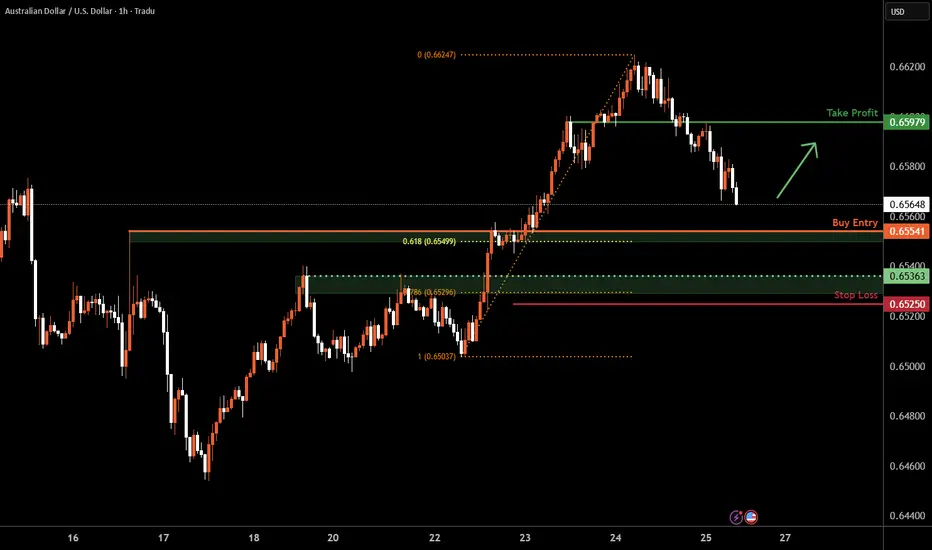
Aussie H4 | Falling toward a pullback supportThe Aussie (AUD/USD) is falling towards a pullback support and could potentially bounce off this level to climb higher.
Buy entry is at 0.6554 which is a pullback support that aligns with the 61.8% Fibonacci retracement.
Stop loss is at 0.6525 which is a level that lies underneath a pullback support and the 78.6% Fibonacci retracement.
Take profit is at 0.6597 which is a pullback resistance.
High Risk Investment Warning
Trading Forex/CFDs on margin carries a high level of risk and may not be suitable for all investors. Leverage can work against you.
Stratos Markets Limited (tradu.com ):
CFDs are complex instruments and come with a high risk of losing money rapidly due to leverage. 66% of retail investor accounts lose money when trading CFDs with this provider. You should consider whether you understand how CFDs work and whether you can afford to take the high risk of losing your money.
Stratos Europe Ltd (tradu.com ):
CFDs are complex instruments and come with a high risk of losing money rapidly due to leverage. 66% of retail investor accounts lose money when trading CFDs with this provider. You should consider whether you understand how CFDs work and whether you can afford to take the high risk of losing your money.
Stratos Global LLC (tradu.com ):
Losses can exceed deposits.
Please be advised that the information presented on TradingView is provided to Tradu (‘Company’, ‘we’) by a third-party provider (‘TFA Global Pte Ltd’). Please be reminded that you are solely responsible for the trading decisions on your account. There is a very high degree of risk involved in trading. Any information and/or content is intended entirely for research, educational and informational purposes only and does not constitute investment or consultation advice or investment strategy. The information is not tailored to the investment needs of any specific person and therefore does not involve a consideration of any of the investment objectives, financial situation or needs of any viewer that may receive it. Kindly also note that past performance is not a reliable indicator of future results. Actual results may differ materially from those anticipated in forward-looking or past performance statements. We assume no liability as to the accuracy or completeness of any of the information and/or content provided herein and the Company cannot be held responsible for any omission, mistake nor for any loss or damage including without limitation to any loss of profit which may arise from reliance on any information supplied by TFA Global Pte Ltd.
The speaker(s) is neither an employee, agent nor representative of Tradu and is therefore acting independently. The opinions given are their own, constitute general market commentary, and do not constitute the opinion or advice of Tradu or any form of personal or investment advice. Tradu neither endorses nor guarantees offerings of third-party speakers, nor is Tradu responsible for the content, veracity or opinions of third-party speakers, presenters or participants.
7.24 AUD/USD ADDED TO WATCHLIST👀 AUD/USD – Watchlist Setup (VMS Strategy)
Monitoring AUD/USD for a confirmed pullback into the marked S/R zone.
What we need to see next:
✅ A clean engulfing candle trigger
✅ Volume and momentum aligned in the trade direction
✅ Entry near the 50EMA, following full VMS criteria
📌 No predictions—just preparation. The setup either fits or it doesn’t.
Keep watching.

AUDUSDafter trap sellers came in range again on mtf. it show bull strength and a liquidity sweep on seller side. we can see a good movemntum on the upside.
make your own analysis before taking trade.

AUDUSD(20250724)Today's AnalysisMarket news:
U.S. President Trump continued to lash out at the Federal Reserve on Tuesday, but seemed to back off from the remaining plan to fire Chairman Powell. "I think he's doing a bad job, but he's going to be out of office soon anyway," Trump said in an exchange with reporters at the White House. "In eight months, he'll be out of office."
Technical analysis:
Today's buying and selling boundaries:
0.6580
Support and resistance levels:
0.6639
0.6617
0.6603
0.6558
0.6543
0.6521
Trading strategy:
Upward breakthrough of 0.6603, consider entering the market to buy, the first target price is 0.6617
Downward breakthrough of 0.6580, consider entering the market to sell, the first target price is 0.6558

AUD USD short as it appears it seems there is a breakout don't rush to it it 90 percent of the time pull back to the original price yet i couldn't find better risk to reward ration on other prices lets see ...
Please note: This is for educational purposes only and not a trading signal. These ideas are shared purely for back testing and to exchange views. The goal is to inspire ideas and encourage discussion. If you notice anything wrong, feel free to share your thoughts. In the end, to learn is to share !

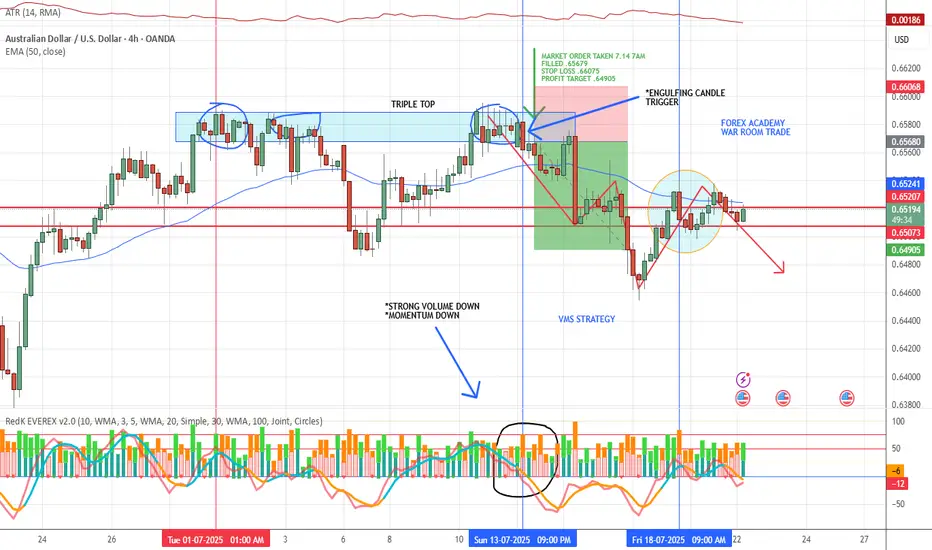
VMS STRATEGY APPLIED📈 VMS Strategy – Triple Top Win Example
We took this trade last Monday based on a textbook triple top reversal:
✅ Clean engulfing candle at resistance
✅ Strong downward volume
✅ Momentum clearly shifting in the trade direction
✅ Perfect timing with all elements aligning
On the 4-hour chart, we focus on specific reversal patterns within the VMS framework:
***Triple tops/bottoms
***Head & shoulders
***1-2-3 formations
***Hammer and shooting star reversals
Each setup must meet all VMS criteria before being considered.
A quick note on back testing:
We know traditional back testing can feel flawed—but here’s what works for us:
Start at the beginning of the month, hide future candles, and scan for VMS setups in real-time conditions. The trade either fits the rules—or it doesn’t. There’s no debate.
We’re not claiming perfection. This strategy does take losses—sometimes multiple in a row. But over time, through strict rule-following and patience, we’ve found consistency and success.
If this helps you, feel free to share it—or even just take a closer look.
With respect, always test it for yourself before trading live.
We’re here to share what’s working for us. We welcome thoughts and suggestions—but know this:
👉 This is a rules-based strategy rooted in discipline, not prediction.
🔒 Aligned Execution is the Edge.
AUSUSDCOT data shows a bearish bias on AUD with net short positioning (-605), while the USD holds a mild net long position (+321). This reflects institutional sentiment favoring USD strength over AUD, supporting a bearish outlook for AUD/USD.
AUDUSD holding, Might Trigger a Upside MoveAUDUSD is still in Solid Sideways Range in Daily Chart. More Probabilities looking towards buy side, looking for liquidity at 0.66880.
It's in Range since 18 April, 2025 and hunting liquidity for both the buyers and sellers. Possibly it could trap seller and go in Buy Side.
In other case, The Sell Momentum can come if it breaks and holds below the 0.64500 Level. Then we can expect a sell momentum till the support level of 0.63400.
Daily is in Range so we can Predict the Price more clearly but if any of level from support or resistance breaks we can see a long-term Opportunity.

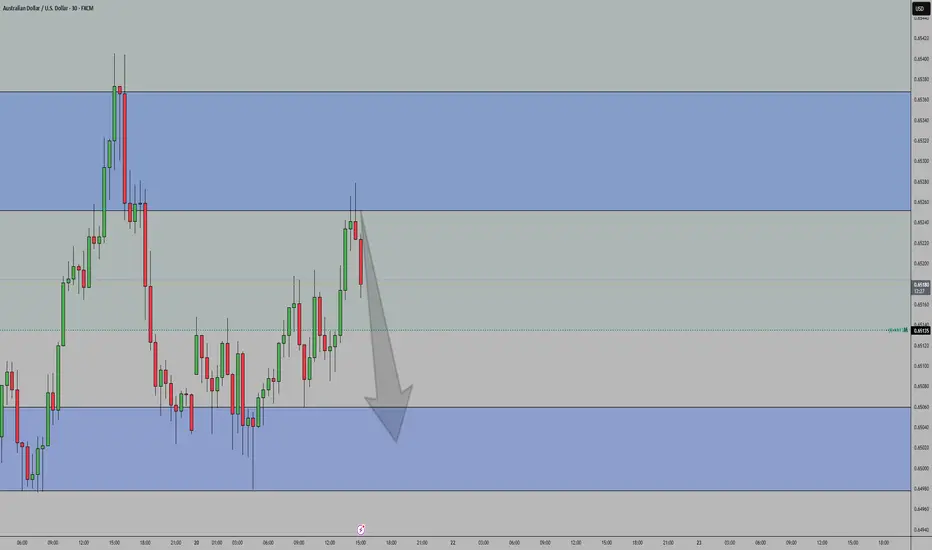
VolanX AUD/USD Tactical Short ThesisVolanX AUD/USD Tactical Short Thesis
The Aussie is showing signs of exhaustion near the 0.886 retracement and has swept major equal highs. Liquidity was engineered and harvested.
Now price is sliding into a vacuum—first target is the imbalance around 0.6440, with a deeper structural demand zone below at 0.6278.
We are positioned via /6AU5 put options, targeting this sweep as AUD re-aligns with declining China demand, copper softness, and USD firmness.
🎯 Trade Type: Long Put (0.6400P)
🎯 Target: 0.6278
🎯 Trigger: BOS below 0.6485
#VolanX #MacroTrading #SMC #AUDUSD #Options #Futures #TradingView #SmartMoney #InstitutionalLevels

AUDUSD Long PullbackOANDA:AUDUSD taking a pullback towards up, catching this pullback.
Note: I am not adding levels etc on chart because I am tired and need to go for breakfast first, simply sharing the what I see.
I manage trade on daily basis.
Use proper risk management
Looks like good trade.
Lets monitor.
Use proper risk management.
Disclaimer: only idea, not advice

AUDUSD(20250721)Today's AnalysisMarket news:
Waller refused to comment on whether he would dissent at the July meeting, saying that the private sector was not performing as well as people thought, and said that if the president asked him to be the chairman of the Federal Reserve, he would agree.
Technical analysis:
Today's buying and selling boundaries:
0.6506
Support and resistance levels:
0.6572
0.6547
0.6531
0.6481
0.6466
0.6441
Trading strategy:
If the price breaks through 0.6531, consider buying, and the first target price is 0.6547
If the price breaks through 0.6506, consider selling, and the first target price is 0.6481

Possibility of uptrend As long as the price fluctuates above the support level, it is expected that the price will advance to the specified resistance level. Then, depending on the price behavior within this level, there is a possibility of a trend change.

Week of 7/20/25: AUDUSD AnalysisLast week's price action was bearish and this week I will follow bearish order flow unless internal 1h structure continues to be bullish. I'm going to look for shorts after 1h internal structure is broken as confirmation, then take trades down to the daily demand zone and then look for bullish signals.


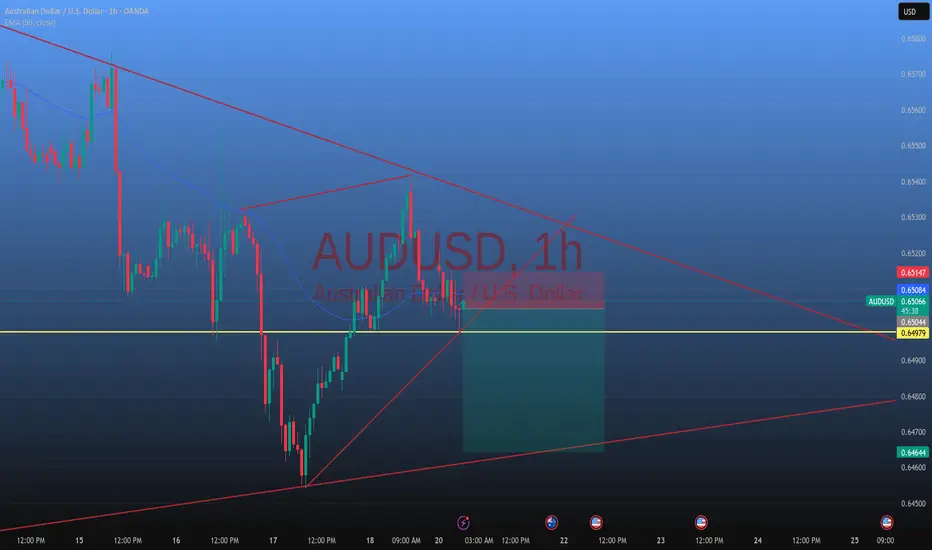
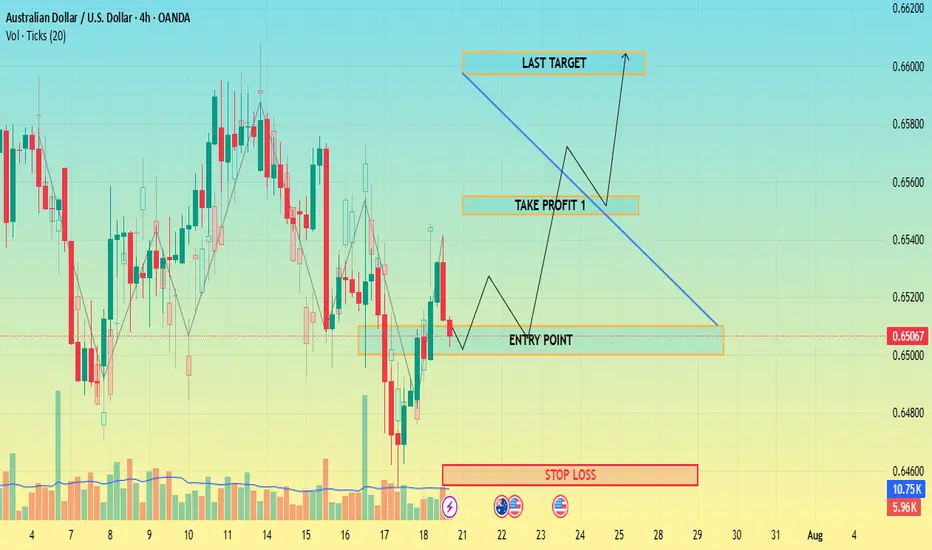
CHECK AUDUSD SIGNAL READ CAPTAIN
Entry Point: Around 0.65100 0.65000
Stop Loss: Around 0.64620
🎯 Target Levels
Take Profit 1:
0.65548
Take Profit 2:
0.66050
AUD USD long to close out the week? With the S&P pushing new highs, the VIX below 17 and recent dovish comments from WALLER. I feel the stage could be set for a positive end to the week. The WALLER comments having moved the needle towards USD weakness into the weekend.
I've left the JPY alone due to potentially strange movent ahead of weekend elections.
The trade is a 20 pip stop loss with a 25 pip profit target.
I've chosen the AUD to long because at the time of placing the trade, it's the currency that has momentum against the other currencies.
It sounds simple but the risk to the trade is USD strength.
If it's ongoing, I will close the trade before end of day to avoid weekend risk.
AUD-USD Local Short! Sell!
Hello,Traders!
AUD-JPY is making a bullish
Rebound and the pair is
Making a retest of the key
Horizontal resistance of 0.6497
From where we will be
Expecting a local bearish correction
Sell!
Comment and subscribe to help us grow!
Check out other forecasts below too!
Disclosure: I am part of Trade Nation's Influencer program and receive a monthly fee for using their TradingView charts in my analysis.

Part 1 Overview of Market Week 13-19 Thanks for tuning in guys, giving my knowledge to you guys free cause. AU,UJ,EU market overview mixing in a lot of fundamental confirmation.

Audusd sellStrong selling expected long term
As usd gonna strong in all cross pairs
Daily weak buy trend breaks
Bearish correction start now

AUDUSDA SELL opportunity on AUDUSD, a little bit of retracement before we have our sell to continue. the overall trend is sideways but within the band, we are favoring the downside more than the upside.
