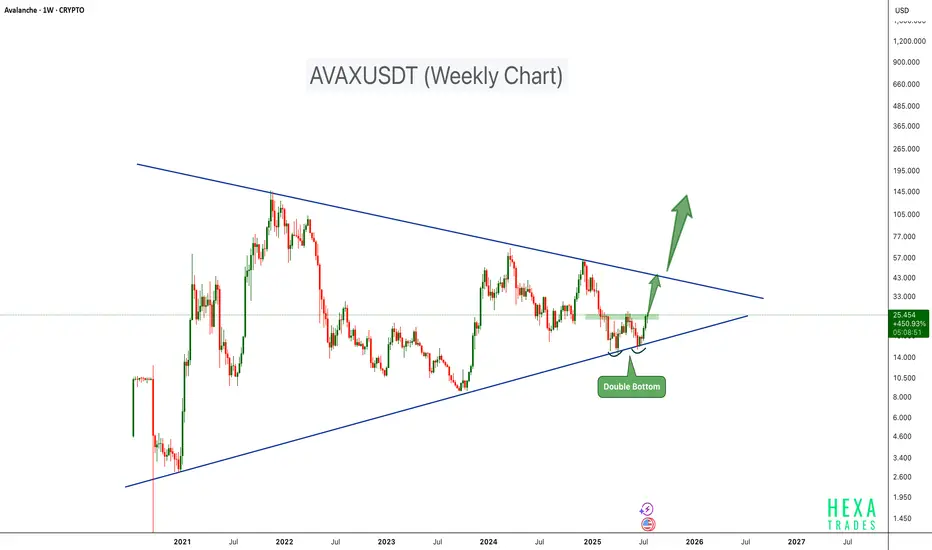
AVAX Bull Run Loading!AVAX is showing signs of a strong bullish setup on the weekly chart, forming a double bottom pattern right at the lower support trendline of a long-term symmetrical triangle. This technical formation often indicates a potential trend reversal when confirmed with breakout and volume support.
Key Poi
AVAX | USDHello!
This is my outlook for AVAX.
Weekly or monthly candle closures above the red price levels could lead us to higher levels.
I hope it can reach the $109 level by the end of the year.
I expect the market to enter a deep correction phase starting from the $54–58 range and ending around the $28–3

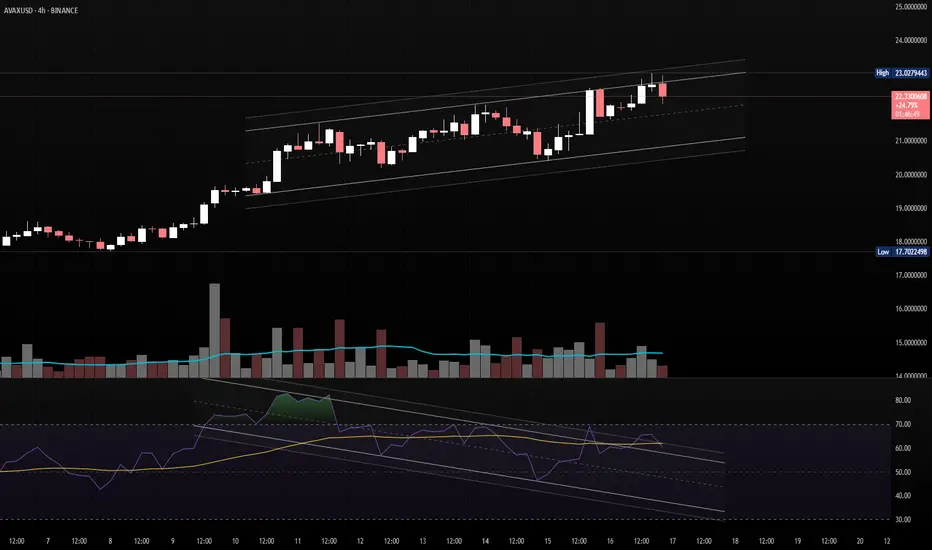
AVAXUSD - Possible Correction from Channel ResistanceStructure: Ascending Channel
Indicators: RSI Overbought, Bearish Divergence Forming
📌 Confirmation:
Look for:
A strong bearish candle or
RSI breaking below 60
Volume divergence
Bias: Short-term bearish correction, bullish structure intact as long as price holds the channel.
An 8.8:1 risk-to-reward trade setup for AVAX.A small pullback is likely at this point. This setup offers an 8.8:1 risk-to-reward ratio with a target of 50.
Entry at 20.8,
Stop loss at 17.50
Target at 50.

AVAX Just Broke Out — Now Comes the Real TestAvalanche ripped through key resistance around $20.50, tapping into fresh highs before pulling back. Price is now hovering just above the breakout zone, which has now flipped into potential support. This is the classic retest scenario — either bulls hold the line and reload for a move toward $25–$27

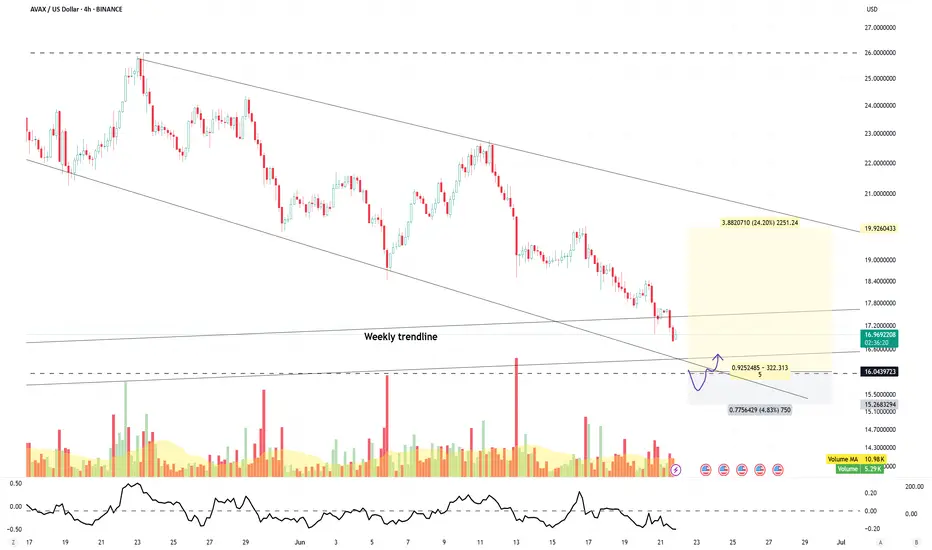
AVAX wait for entryAVAX has been consolidating within the $15–$26 range for the past four months.
Price is currently revisiting the range lows, which also align with the weekly trendline—creating a strong confluence zone.
A bounce is anticipated from this area.
Wait for a confirmed long setup as outlined in the cha
AVAXUSD – Explosive Start, Flag in PlayAVAX rallied from $18.20 into $19.65 in a straight-line surge, clearing prior lower highs. Now coiling just under $19.70, which is a key resistance. A breakout targets $20+. Immediate support is $19.30 — below that risks deeper pullback.


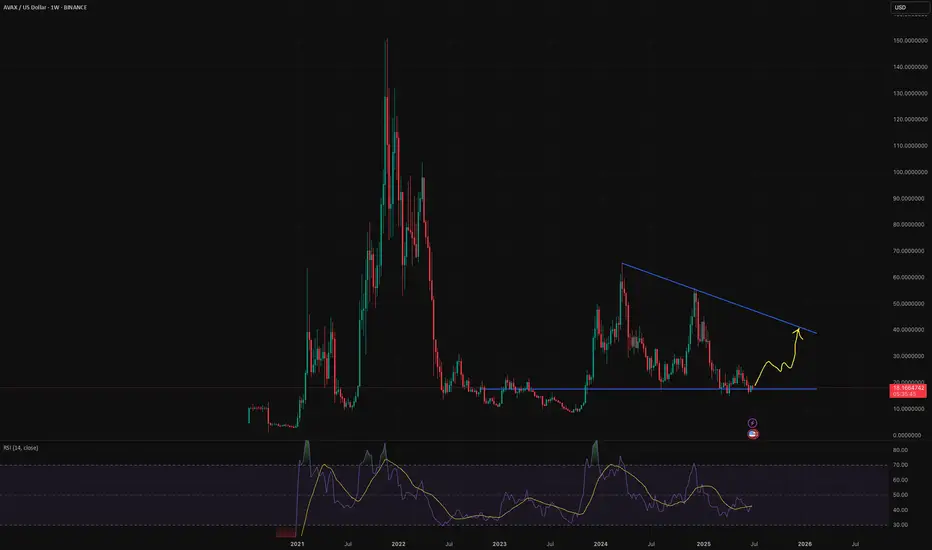
$AVAX will go to at least $40 this year-Almost oversold
-Positive RSI divergence
-at significant multi-year support
-retail sentiment: dead
-undervalued relative to Bitcoin
-in a continued crypto bull market (which I expect in 2025), AVAX will rise too, my first PT is $40 (hitting the descending resistance) with the potential to go much
AVAXUSD – Rally Fizzled, Eyes LowerAVAX broke out impulsively to $18.60 but failed to sustain above $18.00 and quickly unwound. Price has now rounded off into a lower range near $17.30. A small recovery bounce is underway, but it lacks strong volume. The key level is $17.75 — reclaim that, and we could see a move back to $18.00. Unti

See all ideas
Summarizing what the indicators are suggesting.
Oscillators
Neutral
SellBuy
Strong sellStrong buy
Strong sellSellNeutralBuyStrong buy
Oscillators
Neutral
SellBuy
Strong sellStrong buy
Strong sellSellNeutralBuyStrong buy
Summary
Neutral
SellBuy
Strong sellStrong buy
Strong sellSellNeutralBuyStrong buy
Summary
Neutral
SellBuy
Strong sellStrong buy
Strong sellSellNeutralBuyStrong buy
Summary
Neutral
SellBuy
Strong sellStrong buy
Strong sellSellNeutralBuyStrong buy
Moving Averages
Neutral
SellBuy
Strong sellStrong buy
Strong sellSellNeutralBuyStrong buy
Moving Averages
Neutral
SellBuy
Strong sellStrong buy
Strong sellSellNeutralBuyStrong buy
Displays a symbol's price movements over previous years to identify recurring trends.
Curated watchlists where AVAXUSD.P is featured.

DeFi Tokens: Finance 2.0
24 No. of Symbols

Gen 3 crypto: A new day dawns…
25 No. of Symbols

Proof of Stake: Seeking validation?
26 No. of Symbols

Smart contracts: Make the smart decision
36 No. of Symbols

Staking Coins: Pick up a stake
18 No. of Symbols

Top altcoins: Choose your alternatives carefully
28 No. of Symbols
See all sparks