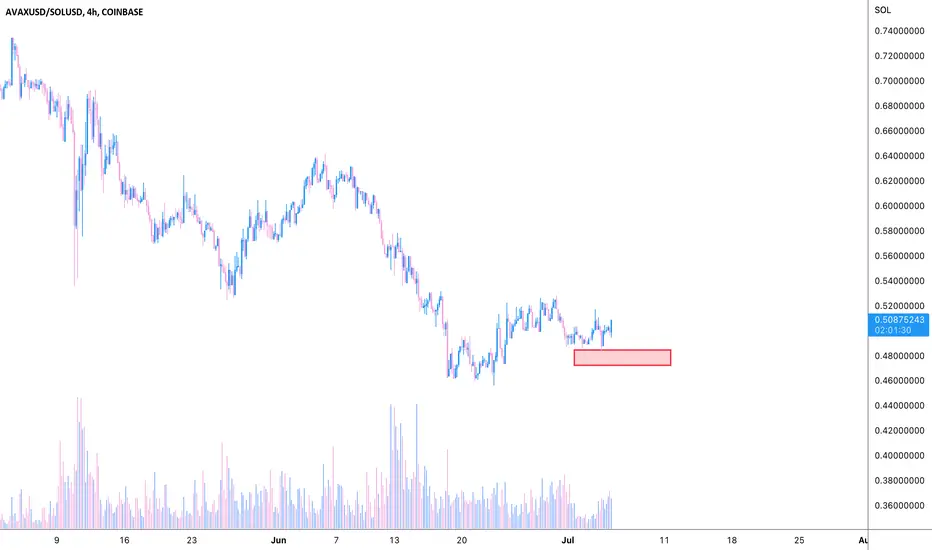
AVAXUSD ❕ before the resistance levelTD Sequential - turning down (4H TF)
RSI - overbought (4H TF)
RSI and price have formed a bearish divergence (1H TF)
I expect that the AVAX may retest the resistance level, and after fixing under it will begin the correction.
AVAXUSD.P trade ideas

avax/usdTesting/tracking elliot wave theory. Please do not trade off idea without S/L. Not financial advice.
The bottom for this coin is in. Wave (2) was around $8. We bottomed out here around $13. Well technically we can still go down to $9 and that would be the bottom, but that is cutting it real close. Going near there or if we go lower, this chart is invalid and the wave counts are off.


$avax > $soly'all can have all the $sol you want.
$avax does not care.
both are great set ups, but gimme the red coin all day.
$avax shortclosed out of previous long right here and flipped short.
need to break this level and hold to confirm.
looking weak as of now.
Bullish DIV on some of the bigger ALTSLooking at AVAX/USD it has the same signature as SOL/USD Leving Bullish Divergence on the higher time frames, LOW LEVERAGE is key because the value of the cryptos themselves go up as well as the profit. Shakeout will be violent at this stage if we decide to move hire. Good Luck

$avax local longbunch of local set ups look really good. especially for a weekend.
taking longer to play out than expected, but 'should' push upward. rsi playing topside.
anywhere between 10-22% move over the next few days.
eth and btc also look solid.
will cut at loss of support. play it by level.

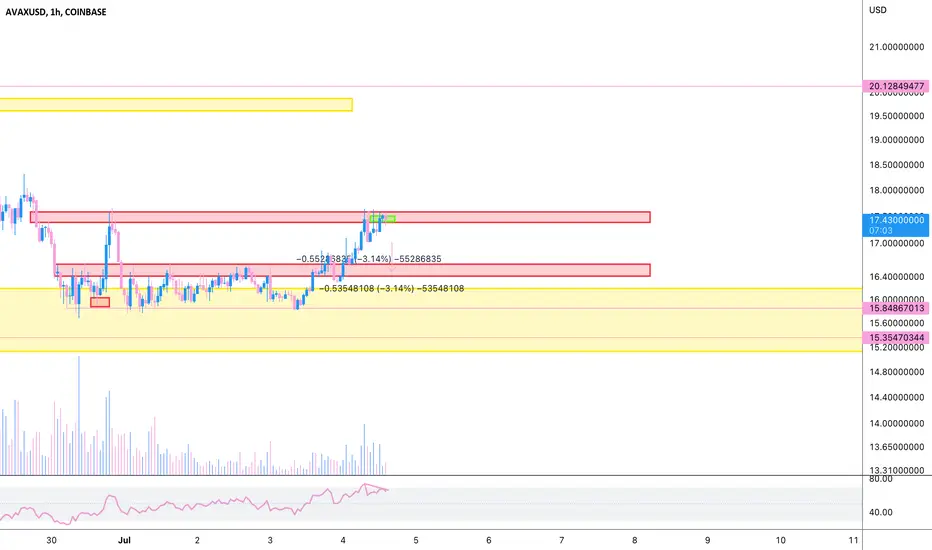
AVAXUSD ❕ downward channelAVAX is moving in a range within the descending channel.
The price is under liquidity.
Trading volume increased on the decline.
Main MAs (1H TF) are bearish.
I expect that AVAX may continue to decline when fixing under the support level.

AVAXUSDThe Head and Shoulder formation is in making. So the right shoulder zone is also a resistance zone. So keep focus on it.

Will Avalanche confirm channel breakout?We see on the daily chart AVAX is breaking out of the channel. If we are lucky enough and bulls hold the line we may do a retest and then off to the moons.

Avalanche Sits at the 0.886 Retrace Awaiting Potential BidsWe are at the 88.6% Fibonacci Retracement and showing Moderate amounts of Bullish Divergence on the RSI if we can catch a Standard Correction of the Downtrend we could see it pump back up to the 200 Day Moving Average which is Currently near the next possible resistance zone above if we were to rally from here.

Avalanche Crypto WorldwideSun Storm Investment Trading Desk & NexGen Wealth Management Service Present's: SSITD & NexGen Portfolio of the Week Series
Focus: Worldwide
By Sun Storm Investment Research & NexGen Wealth Management Service
A Profit & Solutions Strategy & Research
Trading | Investment | Stocks | ETF | Mutual Funds | Crypto | Bonds | Options | Dividend | Futures |
USA | Canada | UK | Germany | France | Italy | Rest of Europe | Mexico | India
Disclaimer: Sun Storm Investment and NexGen are not registered financial advisors, so please do your own research before trading & investing anything. This is information is for only research purposes not for actual trading & investing decision.
#debadipb #profitsolutions

Possible Double BottomPossible Double Bottom on the 1H chart. After confirmation it could push the price up with another 7%.

AVAXUSD Daily TA BullishAVAXUSD Daily bullish. Recommended ratio: 95% AVAX, 5% Cash. *A technical relief rally is underway for cryptos and equities as markets seem to have priced in more rate hikes, I know I focus solely on the Federal Reserve in most of my TA but that's because not only do they fund liquidity for many other central banks but they have been instrumental in setting the tone for the rest of the world for the past decade or more. The Fed was the first central bank to aggressively raise rates in response to global inflationary pressures and in doing so may have earned back a bit of the credibility they lost in being largely responsible for this inflation quagmire. Crypto and equity markets seem to think that the Fed has a plan to navigate us to a soft landing, but it is becoming more and more apparent that a hard landing is likely; when that will be priced in to risk-on markets is the question. Whatever the answer to that question is, we are 'technically' getting close to a short term bottom.* Price is currently following that of other altcoins like Kava and Polygon and trending up out of an eleven day consolidation out of the second largest supply/demand zone on the chart. Volume remains Moderate, fairly balanced between buyers and sellers (indicative of consolidation) and has been shrinking for what is on track to be a fourth consecutive session (indicative of an impending breakout/breakdown). Parabolic SAR flips bearish at $13.80, this margin is neutral at the moment. RSI is currently trending up at 39 after bouncing off of the descending trendline from August 2021 (breaking out of a 10 month descending trend), this is very bullish in the short term. Stochastic remains bullish and is currently trending up at 88 as it aims to resist a bearish crossover on its way to retest max top. MACD remains bullish and is currently trending up at -3.66 as it aims to break out above -4.23 resistance after being rejected the first time on 06/10/22. ADX is currently trending down at 40 as Price is pushing higher, this is mildly bullish at the moment. If Price continues up then it will likely retest the largest supply/demand zone on the chart at $25 before potentially retesting the upper trendline of the descending channel from November 2021 at ~$35. However, if Price breaks down here, it will likely retest the lower trendline of the descending channel from November 2021 at ~$10. Mental Stop Loss: (one close below) $15.

Avalanche Bullish RSI Divergence I think Avalanche will at worst case bottom at 9$. I have started accumulating small positions from 15$ and downwards, will average down and HODL for few months :)

AVAX, is expected to form a head and shoulders bottom pattern.The following are machine translations:
In the 4-hour chart, the right shoulder is currently rebounding after forming a double bottom support near 16, which is bullish.
The fast and slow line of the indicator macd runs above the zero axis, and the energy column shrinks below the zero axis and leans toward the zero axis, showing a bullish trend. The RSI indicator is currently rushing above the neutral 50, a bullish range.
In operation, the head-and-shoulders bottom pattern and indicators are bullish, wait for a long break of the neckline, and look at the vicinity of 22.

$avax wave clooking for wave c over the next few days. htf avax has been strong compared to majors like btc and eth, so will cut early if necessary.
wave c should be roughly equivalent to wave a.
looking for sub $15.


AVAXUSD ❕ Layer-1 projects lose TVLNew Layer 1 projects feel weaker after TVL outflows.
Selling when trying to break through 100MA (1H TF)
Trading volumes show mixed interest.
I expect AVAX may correct if it gets a fix below the resistance level.


$AVAX still to go lower?personally i was aiting for it go 11$ when btc goes 20k but btcD started dumping and avax didn't reach. As accumulation zone might start from 10$ but personally i want near 1-4$ first and then lower. it feels unrealistic but this is the bear market where 99% coin will go too zero.

AVAX finds support at $18, can the bulls defend the level?The Avalanche price analysis shows that AVAX has finally found support at the $18.00 mark, which has caused significant bearish pressure to subside. However, it is unlikely that the asset would show a sharp recovery since the trading activity remains low across the short term.
The broader cryptocurrency market observed a bearish market sentiment over the last 24-hours as most major cryptocurrencies record negative price movements. Major players include BNB and ETH observing an 8.99 and an 8.04 percent decline, respectively.
The MACD is currently bearish, as expressed in the red color of the histogram. Moreover, the indicator shows strong bearish momentum as observed in the high depth of the histogram. Furthermore, the indicator’s lighter shade suggests an increasing bearish momentum as the price action finds support around the $18.00 mark.
The EMAs are currently trading below the mean position as net price movement over the last five days remains negative. However, as the AVAX market turned sharply bearish, the EMAs have started moving downwards, with the 12-EMA taking the lead. At press time, the 12-EMA is diverging sharply from the 26-EMA as selling activity increased in recent hours.
The RSI was trading in the neutral zone since 30 May as the price volatility for Avalanche dwindled across the short-term charts. However, yesterday the indicator dived into the oversold region as. The indicator is currently moving upwards as the price action finds support at the $18.00 mark. However, strong bearish pressure still weighs on AVAX markets.
The Bollinger Bands were narrow until June 10 but then exhibited sharp divergence as the price action observed sharp volatility. Currently, the indicator is still expanding to facilitate the sharp bearish activity. At press time, the lower limit provides support at the $18.02 mark while the mean line presents resistance at the $22.32 mark.

AVAX/USDT Long scalp possibilityHey Colleagues,
Hey there, the market was bloody red today but we see some possibilities to scalp some longs. We are opening a long position for AVAX here with Stop at $14.5. Profit all the green zone
If you like ideas provided by our team you can show us your support by liking and commenting.
Yours Sincerely,
Swallow Team
Disclamer:
We are not financial advisors. The content that we share on this website are for educational purposes and are our own personal opinions.
