Avalanche (AVAX) Big Resistance at $100Avalanche (AVAX) like most of the market has been in a slow steady downtrend since November of year. Since then Avalanche has been struggling getting back past $100 and has been trading under the 0.5 Fibonacci level between $60 - $95 since the beginning of this year so far.
In terms of Total Value Locked (TVL) in DeFi Avalanche ranks 5th with a total of $11.22 Billion locked. Despite the market crash and volatility Avalanche has held over $10 Billion in DeFi locked since November 2021 and has remained pretty steady. There's a huge resistance for Avalanche at $100 and even though we've had some relief we're still not quite out of this downtrend for Avalanche until we can break past $100.
Much peace, love, health, and wealth!
AVAXUSD.P trade ideas

AVAX HAS BEEN RANGING AFTER A RALLY UP.AVAX has seen some positive moves. this asset is currently around FIB 61.8 ($80) which is also acting as a support level.
This asset may see a move up to the next FIB level at around $92 if fundamental favours this direction.
If this asset breaks down below $85, the next support will most likely be around FIB 50 ($81)

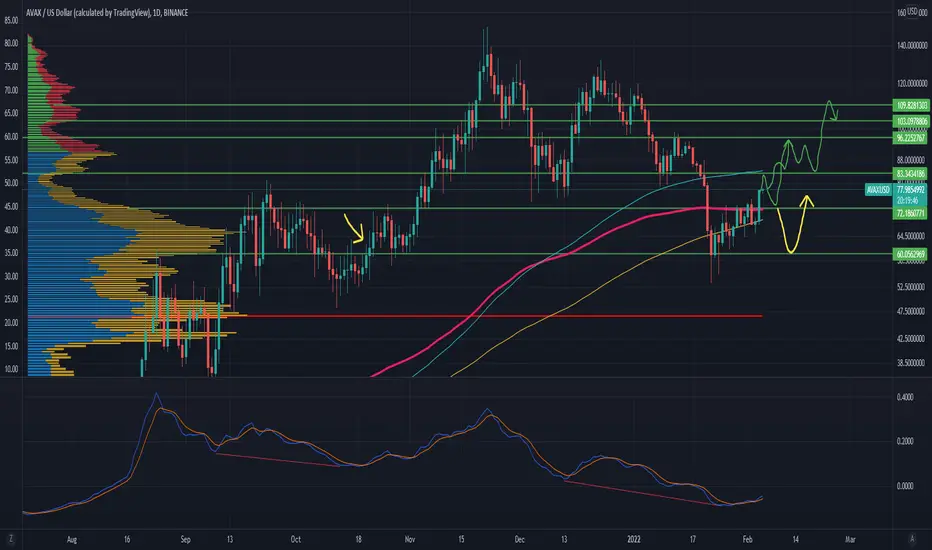
avax swing~looks like avax is gearing up for a little move,
potentially for wave C of an a-b-c.
it's possible this is also a 1-2 as well, in which case it would go a lot higher than what i have projected on my chart.
the burgundy 100% extension is the target for this trade,
a safe exit is at the green -0.236
(if it pushes to the yellow 1.618, expect a larger move to the upside).

AvA X ; now how do we pronounce it? 1 of the recent strong altsAvA X ; now how do we pronounce it? 1 of the recent strong alts
'avax' or 'ava..ex'?
wgaf right
one of the strong ones lately. bag holding for recovery pumps. dont think they are over yet.
AVAX Swing ShortTargeting previous lows after recent daily low was taken.
SL above higher liquidity gap. This is consider the clear H&S pattern.

AVALANCHE Scenarios If AVAX loses closes week below $80 again and loses $50 support it will confirm H&S with ultimate downward PT at $9. However if it holds $33 -$30 area which falls on Trendline support it will have to decide which way it go from there. $33 to $9 or $33 to New ATH. I’m currently Neutral leaning short on this crypto

AVAXUSD 4 hr - This is how i read these charts. Its like seismicThis is my best, as of right now, way to explain my usage of this info. some of it i have to say is just what catches my eye. Certain shapes. I don't assume the price will go there but i assume i am one of millions and what i think is what another would think even wrapped in a different story. So what interest me is result of my non language pattern recognition and my internal dialogue sorting through relevant world influence. Right now i am using the definition that i am following the point between belief and disbelief.

AVAX wants 80avax shark with a higher low, rsi trendline jump across the creek with successful backtest, potential c-d leg of smaller bearish bat and or gartley being painted implying upside, btc pair also shows a jump across the creek and potential bat pattern

AVAX SHORT! Bearish Divergence on the RSIBearish divergence. I see a great opportunity here being that the overall market has been showing signs of weakness. Placing a stoploss at $84. This isnt a 1 day or 1 week trade I anticipate this taking a couple months to play out. Cheers
Target #1 $38
Target #2 $24
Target #3 $14

Ascending TriangleAVAX has been trading within an Ascending triangle for a while now. Last night the PA broke out to the downside along with Bitcoin.
It is currently trading in a key support/resistance zone (white box). The bearish breakout occurred with relatively low volume and we have yet to see any kind of bearish follow through. Because of this I am looking for a move back inside the pattern and another push at the major downtrend TL. This, of course, is assuming Bitcoin doesn't decide to completely die.
Targets for potential bounces if lower are the 1.272, 1.414, 1.618 fib extensions. Measured move PT if back inside the pattern and bullish breakout: ~$140.

Avax Double Bottom T2 Return of Bullish GartleyAfter a type 1 reaction of the bullish Gartley, the price returns back to the harmonic optimized price this forms the second leg of a double bottom. Buy at confirmation of bottom, ride the neckline and take profits. After confirmation test of the neckline add more position and take profits at T2 and the measured move. Set a stop loss below $50 and below $80 for the second entry.

More upside!We have taken a LONG position on AVAX, retracement to the 0.618 level completed looking for more upside to the upperside of the channel.


AVAX, bullish trend.The following are machine translations:
AVAX is still in an uptrend.
In an uptrend, the pullback hits the uptrend line and bounces back.
Continue to see more in the direction.
Above resistance near 100.
Operate more than one order, and stop below the rising trend line.

I think avax will valued I think avax will valued to 115 dollars beaucause it did turn fibonacci 0.615 and usually turn on the fibonacci 0.615 goes to 1.615

AVAX behaves like BTC,to retest 115; only DMA100 can stop itGood news: eToro just added AVAX & HBAR my favorite.
AVAX chart behaves like BTC. I think its hidden agenda is also, like BTC, to retest 115 which is the intersection of 3 impt lines: the GANN fan line, a horizontal resistance & the blue uptrend line started in Aug 2021. It broke this line last Jan & is now going back up to retest it.
(BTC already went back up & retested its uptrend line & failed)
Notice it BO the maroon downtrendline which is also a GANN fan line. AVAX is going to the next GANN line at 115.
ONLY the violet dma100 line is left to stop AVAX. ALL othe DMAs are already supports.
Not trading advice.

$AVAX Inverse Head and ShoulderInverse Head and Shoulder on 1H, 4H, 6H and the daily so hopefully it plays out.

AVAX Long I XMR ShortI'm looking for Pairs to trade against each other to offset the risk of a single trade.
With a "± simple" calculation of each possible outcome of A UP / A Flat / A down - B UP / B Flat / B down i look wich move in A/B is the most likeliest.
AVAX / XMR UP 2 5%
AVAX / XMR Down 1 42%
XMR / AVAX UP 0 3%
XMR / AVAX Down 2 45%

Update: Avalanche (AVAX) critical support confirmedUpdate: Avalanche (AVAX) critical support confirmed as great support
... volume profile support
... FIB golden pocket
... support on OBV
Will these 3 support-combination have been strong enough! 😎
Will AVAX break $100 again soon? What do you think?
Drop me a nice comment if you'd like me to analyze any other cryptocurrency.
*not financial advice
do your own research before investing

AVAX, the third wave opens.The following content is machine translation:
The big Yangxian closed yesterday, which means the end of the 2-wave callback.
Currently in the bottom 3 waves up.
Short-term resistance 100, break through 100, look around 120.

Avalanche (AVAX) - February 16Hello?
Traders, welcome.
If you "follow", you can always get new information quickly.
Please also click "Like".
Have a nice day.
-------------------------------------
(AVAXUSD 1W Chart)
It is gaining support near section A and is rising.
To continue this uptrend, we need to see if we can sustain the price above the 80.9999458-87.6501953 range.
If it falls from the point of 80.9999458, Stop Loss is required to preserve profit and loss.
(1D chart)
A break from the downtrend line is expected to find resistance at 110.4609778-123.9095360.
In the CCI-RC index, since the CCI line is located in the range of -100 to +100, AVAX can be considered to be located in the sideways section.
Therefore, when the CCI line deviates from the range of -100~+100, a trend is expected to form.
------------------------------------
(AVAXBTC 1W Chart)
Above 0.0015196 point: Expected to create a new wave.
We need to see if we can continue the uptrend along the uptrend line.
A volume profile section is being formed around the 0.0015196 point.
So, if it goes down from the 0.0015196 point, it is likely to turn into a downtrend.
------------------------------------------
We recommend that you trade with your average unit price.
This is because, if the price is below your average unit price, whether the price trend is in an upward trend or a downward trend, there is a high possibility that you will not be able to get a big profit due to the psychological burden.
The center of all trading starts with the average unit price at which you start trading.
If you ignore this, you may be trading in the wrong direction.
Therefore, it is important to find a way to lower the average unit price and adjust the proportion of the investment, ultimately allowing the funds corresponding to the profits to be able to regenerate themselves.
------------------------------------------------------------ -----------------------------------------------------
** All indicators are lagging indicators.
Therefore, it is important to be aware that the indicator will move accordingly as price and volume move.
However, for convenience, we are talking in reverse for the interpretation of the indicator.
** The MRHAB-O and MRHAB-B indicators used in the chart are indicators of our channel that have not been released yet.
(Since it was not disclosed, you can use this chart without any restrictions by sharing this chart and copying and pasting the indicators.)
** The wRSI_SR indicator is an indicator created by adding settings and options to the existing Stochastic RSI indicator.
Therefore, the interpretation is the same as the traditional Stochastic RSI indicator. (K, D line -> R, S line)
** The OBV indicator was re-created by applying a formula to the DepthHouse Trading indicator, an indicator disclosed by oh92. (Thanks for this.)
** Support or resistance is based on the closing price of the 1D chart.
** All descriptions are for reference only and do not guarantee a profit or loss in investment.
(Short-term Stop Loss can be said to be a point where profit and loss can be preserved or additional entry can be made through split trading. It is a short-term investment perspective.)
---------------------------------

AVAX Decision Point Avax is approaching a critical confluence of trend and trading range midpoint. Will it go up or down? The bar volume reads institutional accumulation for the past few months, and the PA has shown clear bullish sentiment. But the market is still fidgety and flighty with all the extraneous things going on in the world today which are able to nullify your technical analysis in the blink of an eye. That said, let's watch where it goes!
*Not financial advice and not a prediction; just speculation of a possible outcome. DYOR, trade at your own risk, and always use a stop loss. Good luck!
