Inverse Head and Shoulders AVAXUSDInverse Head and Shoulders forming on daily chart. Look for entry when price breaks through neckline at around $134-$136. Target price at $190.
NFA DYOR
AVAXUSD.P trade ideas

Long AVAXUSD - A rise to $235First and foremost this is my own hypothesis and in no way suggests a buy or sell advice.
We reached a bottom during the correction phase of our white impulse towards $76.
We are now in the process of forming our wave 3 which will most likely go for the 1.618 Fibonacci to reach $235 before correcting again.
Furthermore, we will be able to validate the bullrun scenario once Avalanche has passed $131.
A first objective towards $200 offering us a beautiful opportunity of 90%, attention in counterpart not to go down below $96.
Let's give AVAX time to validate this analysis.
If you agree with this scenario let me know with a like.
Otherwise let me know your point of view with a comment!

AUX Neutral / First Bullish and then BearishCreating Bearing Bash will most likely turn around the trend from Bull to bear, good time to jump in for Bull and then short at D-point.

Avalanche (AVAX/USD) Long IdeaAfter a 62% retracement a few days ago and movement into a 4hr time frame orderblock, I believe price is now heading down to fill in price gaps found on the weekly, daily, and 4hr time frames. I'm expecting AVAX to go long after reaching the 93$-89$ price range.

AVAX TESTING CRITICAL SUPPORTAVAX is testing critical support levels after completing a bearish move out of a head-shoulders pattern.
AVAX is not holding up as well as well as expected during this correction.

avax/usdAVAX - avalanche will explode soon, maybe march or april (IDK exact time)
SO that i'm holding it
In my opinion, we will see avax deep again (~80 bucks)
Cause this rocket is in triangle and it will explode in few months
shortly i will say, avax target is ~190-200$
from now it will be 2x (~100%)
but if avax will drop on deep (~80$) then profit will raise to 2.5X
WISH U LUCK!

AVAX - Hopeful BounceI think as oversold as AVAX is, as well as BTC , we should get a bounce here. Maybe higher than the target. NFA, DYOR

AVAX/USD Avalanche possible Bearish Butterfly formation on dailyTrade Breakdown:
1. Buy around $95-$88 area, with stops below $80.
2. 1st PT @ $157, 2nd PT @ $167.
Good luck!

AVAX LONGBroke out of triangle with volume, now retesting previous resistance and also 200 EMA.
Look to take advantage of a rebound off these levels for a quick LONG.
TP at the next resistance levels, SL slightly below 200 EMA

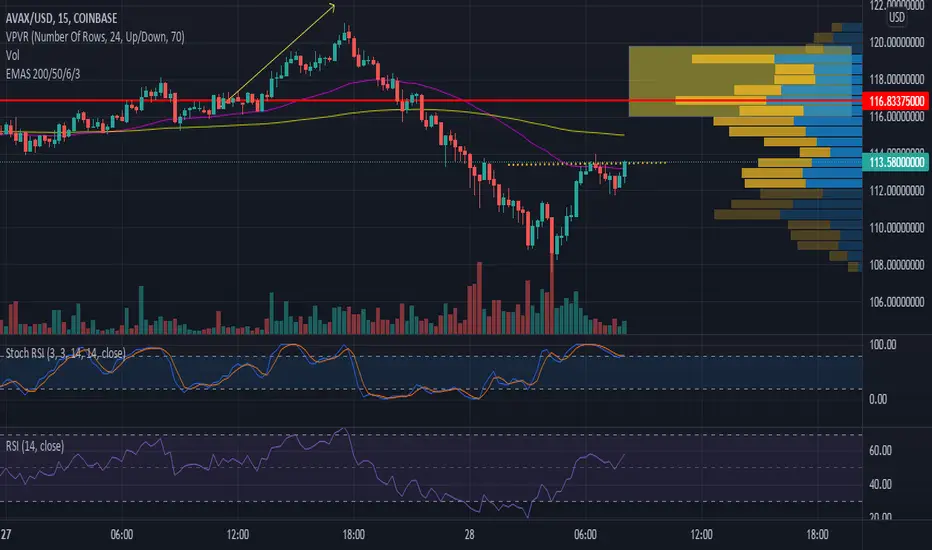
AVAX should see $120 again ASAPI took a gamble and bought $108.50 but as I look at the chart now around $113, not even the 15 min is over bought. I have some scalp targets to watch for selling. NFA, DYOR
AVAX/USDT - Potnential 82% SetupHello Traders!
The struggle for liquidity among ecosystem projects continues unabated. In 2022, we will see a further confrontation between ETH 2.0 and its layer-2 solutions versus existing layer-1 solutions with and without EVMs. This is something we can take advantage to make money.
AVAX has started a new upward movement.
It is better to look for an entry on correction in the range of $98.00 to $107.50.
Stop-loss shall be placed under the level of $78.50
The targets will be the Fibonacci levels:
$141
$159
$179
Good luck and watch out for the market
P.S. This is an educational analysis that shall not be considered financial advice

AVAX- Inverse Head and Shoulders About To ExplodeAvax is breaking up and perhaps about to perform an inverse head and shoulders, I have a conservative target of $120 and $122 is also easy just in one push up. This could be a nice impulse on hourly. NFA, DYOR

LONG AVAX SHORT FOR A FEW DOLLARSOk im long avax but i shorted at 125 and will look for buys in the support ranges. This block chain is FAST and EFFICIENT and cheap transaction fees unlike ETH.


AVAXUSD (4H) Bullish wave We2Hi Traders
AVAXUSD (4H Timeframe)
A Med-High probability, entry signal to go LONG will be given with the upward break of 121.20 after the market found support at 109.20. Only the downward break of 109.20 would cancel the bullish scenario.
Trade details
Entry: 121.20
Stop loss: 109.20
Take profit 1: 139.00
Take profit 2: 157.00
Score: 7
Strategy: Bullish wave We2

AVAX for dip back to 100 , then a rip to 170 afterAVAX for dip back to 100 , then a rip to 170 afterAVAX for dip back to 100 , then a rip to 170 afterAVAX for dip back to 100 , then a rip to 170 afterAVAX for dip back to 100 , then a rip to 170 after

AVAX/USDT - MACRO BULLeither way, it looks like we have the famous accumulation patterns forming.
see the patterns, but being patient on execution as you can get caught on the wrong side.
Safe trading all

AVAX Fib ext. next projected high before retracement AVAX on 4h view, I cloned the first fib extension to project the last. I choose to clone this extension because the rise in price at this time was largely unaffected by markets. The initial rise from low 82's to low 100's was due to AVAX bringing on USDC and I believe 2 other DEFI platforms. The extension I choose was post retracement of this news. It also seems to be the most realistic and least volatile, cause all the other clones of extensions from this recent bull run would put us at 139+ by the end of the weekend. I don't seen that happening by the end of this weekend, but i do see it happening before the next bear market hits. Happy Holidays & Happy trading all!

Looking for Quick Profits on $AVAXI like $AVAX for a quick bounce. I've already made two entries within that little circle, will triple down if we wick below $120. Hoping to exit in the next 4-8 hours.

Avalanche - Ready for more action, Bull Flag w/ $140 TargetAVAX has been on a tear and with a healthy consolidation here I have loaded up on more. You may see more sideways action for a bit into the green zone, watch for high volume confirmation of breakout. I have a target of $140 and stop loss of $115. NFA, DYOR

AVAXUSDT Bullish Butterfly Nearing Point CAVAXUSDT is about to finish point B in the level of 138. From there, you can expect a consolidation as low as $37 for now, congratulations to those who followed my trade plan and managed to enter at $75!
Plan:
P.S. This is for educational purposes only.

AVAX USDT Long SetupAVAX USDT showing great relative strength
Expecting a slight dip in coming days
Will be a great opportunity to load up
This will be one of my leading coin for next Alt Season
BTC should cooperate

Previous AVAXUSD chart w/the potential Descending triangle addedNot 100% confident about this descending triangle pattern yet. But if it is indeed valid then the price action should head towards the 158-160 target before too long with some resistance on the way there at around $130 or so depending on where we retest this ascending yellow trendline at.
