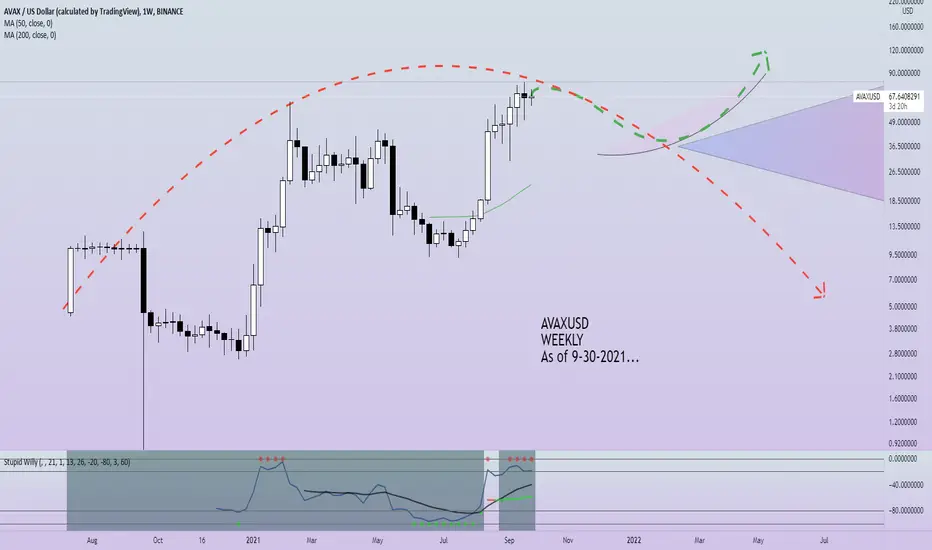
AVAX buidling the 3 Elliot Wave for a new highIt will take AVAX around 1 to 3 weeks to do a new ath attempt, and it will most likely do.
The altcoins dominance is starting to be more patent since yesterday giving more chances to this ETH competitor to go to the $100 mark.
Appreciate the hard work by clicking the like button.
Happy trading,
Raf
AVAXUSD.P trade ideas

AVAX support retest (long it)I'd love top pick up $AVAX on the red box. I think this only happens if $BTC retests 52K though...
setting bids and waiting


AVAXUSDT LONGAVAX is an asset that has seen a massive positive change. Thanks to the strong buyers in August, who got the asset to it's all time high of 80.99. Although, we have seen a slight downtrend from that peak inn the previous week.

AVAXUSD PRICE PREDICTION Look like AVAX would retrace to $42 before running to 195$ Market cap: $44 billion.
195$ is good price to exit most of my fund off the market
And let some ride to the moon or maybe just lose them all.
Moon target $600 AVAX and $135 billion dollar market cap.
Not considering the blackswan event.
Good luck to you all.
NFA

AVAX/USDT Extremely BullishAVAX/USDT Extremely Bullish.
Weekly Candle closed above the ascending parallel channel
Still on resistant turned support level. Could bounce from this level.
Target $100+

Expecting a couple of more retests of $58 support lineAVAX price has been hovering around $60, having the 40-days moving average line as a support. I see another support line around $58, which I expect to be retested a couple of more times before it decides to break up or down the triangle.
It's my very first idea to publish. I'd appreciate any feedback :)

The AVAX PlayIt's quite simple. Bull run continuation = new aths across the board.
Stop is wide to account for Alt bleed while btc pumps. Once Alts pump will be all good.
Target: $110

AVAX- Buy from support Hello,
Today the price has triggered my pending buy order on AVAX.
I sold 33% previously at the local high at $80 with the intentions of buying back between $57/$60.
My next sell target will be $100, again I will sell 33% with the intentions of buying back the 33% at new support at $80.
Good luck if you join.

AVAX - Potential Break Out SoonAvax seems fundamentally secure for investment and technically it's getting well positioned for a nice run up. I have been watching for this with patience, I do hope the timing is correct. Not financial advice.

AVAX trade, going to 76.5ishTaking the retest and support of the weekly level, to the daily level above. Nice and easy trade


AVAX - Top of ChannelMidline has held nicely for AVAX, looking for a move towards the top of the channel in the coming week(s)
not trading advice
tg

RUN it back AVAX AVAX has been consolidating above ATH support zone and printing a falling wedge structure. expect bullish continuation towards triple digits here soon

AVAX WeeklyAnother new coin rolled out on coinbase pro and then likely coinbase .
What's this one "do"?
$AVAX$AVAX is looking promising! If we use the past as our reference we see $AVAX started off breaking out of what could have been a cup and handle, then a consolidation period right back into another cup and handle and we are at the breakout point now. If the market changes direction the project will easily double from here and continue in my belief to about $300+/-.
Remember investing involves doing your own research. Never invest blindly. THIS IS NOT FINANCIAL ADVICE!

AVAX Bull Flag on 4H?First time spotting a Bull Flag.
AVAX stayed within the Parallel Channel for almost 4 days, if it doesn't break it's Long term Support (around $62) I expect price to retrace to $73.
MACD is flattening on a 4H chart, so keep an eye out for a Cross Up.
Resistance levels are marked R1-4.
FTX:AVAXPERP BINANCE:AVAXUSDTPERP

$AVAXRisk to Reward favourable despite the fud, market will see higher prices. Record low btc on exchanges thus lack of liquidity, resulting into a volatile market. The underlying facts still stand and on-chain data points to the inevitable. Stay safe and have a great weekend guys!


Avalanche Fibs & Volume ProfileThe chart of AVAX. We can see the volume profile on the side is acting as major support around 40, in confluence with the 38.2 fib. Short term resistance around 60, real support at volume shelf.

AVAX just passed the resistanceI realized AVAX has growth more than 481% since July
And
STILL UPPP
Wave 3 will hit 280

$AVAX reversal after market wide dumpAVAX has made a double bottom on the 4H support level, and with the market slowly recovering it seems to be one of the more likely ones to recover

avaxusd avaxDigitize All The World's Assets. Avalanche is the fastest smart contracts platform in the blockchain industry, as measured by time-to-finality, and has the most validators securing its activity of any proof-of-stake protocol
