AVAX - Big One? Hi, this is my new update for AVAX. As you see we are in a big range over 6 months now and I expect we are going to takeoff in the next couple of weeks.
In the picture above you see Ethereum in 2017 and it seems that we are going to try something similar to what Ethereum did.
Right now we are in the yellow circle and we are backtesting the trendline. If it holds then we are getting ready for 170% upside with the main target 95-100$.
We have still things to settle, like the RSI and the moving averages. The RSI is still bellow the trendline.
We have good support level around 28 -31$ and big resistance around 55-65$.
Good things take time, be patient.
AVAXUSD.P trade ideas

avax is bullishAvalanche is a layer-one blockchain known for its speed and low-cost transactions, positioning itself as a strong competitor to Ethereum. The recent developments and strategic advancements in its network have bolstered its potential for significant growth.
The current bullish sentiment in the crypto market, coupled with strategic investments in the altcoins, positions investors to potentially reap substantial rewards. As the market dynamics evolve, the altcoins are expected to outperform and achieve new ATHs in the coming year.

$AVAX needs a retest before rallying#avalanche #avax price needs correction in mid term, orange boxes are the supports. Short term bounces may become bull traps. NOT FINANCIAL ADVICE.

AVAX Possible bust cycleWith bitcoin being in a state of uncertainty, AVAX has been in a downtrend from the 150 area.
Reasons:
- Lorentzian classification sell signal plus
- ML Pivots breakout area at 26.72 (possible resistance)
- Low volume in the area meaning possibly little resistance to a downwards movement.
- If it does manage to break this consolidation area, the VPVR volume indicator shows little market participation until 16.00 indicating the potential for a free fall.
Considerations:
- We have not yet fully broken a previous consolidation zone, however the distance from the ML trendlines suggests a significant momentum down.
Please note this is only an idea and not advice on whether you should or should not risk your money. This is not financial advice. Good luck.

Levels to watch on AVAXDisclaimer: This is not financial advice. Most traders lose money. Trading in digital assets, including cryptocurrencies, is especially risky and is only for individuals with a high-risk tolerance and the financial ability to sustain losses.

What is the social sentiment of Avax?The social sentiment around Avalanche (AVAX) appears to be mixed but leaning towards the positive side. The social dominance metric, which measures the percentage of social media mentions a cryptocurrency attracts in reference to the top-50 most talked about projects, has reached its lowest levels since November 2023. This indicates that discussions and mentions online about the AVAX token when compared to the top 100 are low. However, this low social dominance could potentially precede a rally in Avalanche, as similar patterns were observed in October 2022 and January 2023, where spikes in social dominance were followed by an increase in the AVAX price.
Furthermore, there have been recent developments and initiatives within the AVAX ecosystem that have generated positive sentiment. For instance, the announcement of meme coins being incorporated into the Avalanche Foundation's portfolio has led to a surge in meme token prices, with one prominent meme coin, COQ INU ($COQ), experiencing a notable surge in valuation. This move by the Avalanche Foundation has sparked enthusiasm within the AVAX community, demonstrating the community's support for a broad spectrum of digital assets.
Additionally, the launch of the Cortina upgrade aimed at enhancing the developer experience and utility of the AVAX blockchain has contributed to a positive outlook. After the upgrade, the AVAX price climbed, yielding nearly 5% gains to holders since Tuesday.
In summary, while the social dominance metric for AVAX has been low, recent developments and initiatives within the ecosystem have fostered a positive sentiment among its holders and the broader crypto community.

AVAX to $80 Incoming?Every alt is primed right now after being dumped for a bit to reach the monthly average and being ready to catapult with the mid year cycle. I can see btc at 80k+ in the upcoming 3 months, causing a alt season to occur, trade with caution!

AVAX updateAVAX in a slump here, down 32.6% in the month. Bigger picture up 93.1% in the year, just about 5% today. I see a cup handle forming, just waiting conformation from the last battle. Even though AVAX ain't looking pretty i think its has a solid foundation, strong supports from investors. Just waiting on confirmation.

AVAXUSD 15min Short above $39As we embark on this visual journey let us harness the power of knowledge to illuminate our path forward... Together we can unlock the potential within these charts and empower each other to drive impactful decisions and conquer new horizons.
Wave (5) was truncated. Finishing wave 2 above $39 in corrective fashion.
Avalanche is a layer-1, proof-of-stake blockchain, posing as a direct rival to Ethereum given its focus on smart contracts and aim to accommodate a plethora of decentralized applications. Launched in 2020, Avalanche's network offers high transaction throughputs.

AVAX Long against 26.80Entering a long position inside a 100-161,8 % fib extension C=A
T1 37
T2 80
SL 26.80
Risk 2%
Great Risk /Reward ratio for an explosive move UPCaution: It's not going to the Moon, today. The move will take time but the Trend is UP. The manipulation/market dump by whales was expected. It has reached the level we have been waiting for. However, more manipulation/Volatility is expected around halving of Bitcoin. Whales/Banks/Funds work contrary to the amateur influencers. Use good money management principles while entering into any position.

Avax Long Entry at Key Confluence 45.50
AVAX completed a 3-wave pullback on the 4H timeframe.
Entering long at 45.50, a confluence of:
50% retracement of the 27-65 swing
100% Fibonacci extension (y=w, log scale)
Targets:
T1: 52.50
T2: 85-90 area
Stop-Loss: 35.20
Risk: 1%
R:R: +2
AVAX Long Term Bullish - (April, Technical Analysis)Avalanche (AVAX/USD) If in doubt, zoom out! Despite the recent crash on most coins, some have experienced a larger fall. However, AVAX is still forming: "Higher High's & Higher Low's" on the trend line pattern from the chart. Is this recent dump before the BTC halving a shakeout so that whales can accumulate even more??
AVAX held support from the recent crash touched perfectly on the 50% fib retracement at: "$35" and bounced off. A retest to $65 price in the future is very likely soon as Avalanche is still looking bullish long term for 2024.
Line of Support= $35🟢
Minor Resistance= $45🔴
Major Resistance= $65❌
Target!= $75🌟
‼️DISCLAIMER PLEASE READ CAREFULLY‼️
*(THIS NOT FINANCIAL ADVICE, ALWAYS DO YOUR OWN RESEARCH! I AM NOT RESPONSIBLE FOR ANY LOSS OF EARNINGS FROM ANY INVESTMENTS THAT YOU MAY MAKE BASED OFF ANY OF MY IDEAS. ONLY INVEST WHAT YOU CAN RISK TO AFFORD TO LOSE IF YOU MAKE THE DECISION TO DO SO. DO NOT INVEST, UNLESS YOU'RE PREPARED TO LOSE MONEY, IF NOT ALL.)
(CRYPTOCURRENCY CAN BE HIGH-RISK INVESTMENTS DUE TO THE VOLATILLITY OF IT'S NATURE, AND YOU SHOULD NOT EXPECT TO BE PROTECTED IF SOMETHING GOES IN THE WRONG DIRECTION. SEEK PROFESSIONAL ADVICE FROM A CERTIFIED FINANCIAL ADVISOR.)

AVAX/USD 2h: just a few pips, but there's money on the tableThe AVAX/USD pair exhibits promising signs of an upward trajectory on the 2-hour chart, marked by key technical indicators. Initially, a regular bullish divergence was spotted, a reliable harbinger of potential reversal. This divergence occurs when the price charts lower lows while the RSI (Relative Strength Index), an oscillator measuring the momentum and possible trend reversals, shows higher lows. This discrepancy signals weakening downward momentum, suggesting that buyers are gradually gaining ground.
Complementing this bullish signal, the MACD (Moving Average Convergence Divergence) indicator, a tool used to identify trend direction and momentum, crossed above its signal line prior to the divergence. Currently, the MACD and its signal line are advancing in parallel, reinforcing the bullish momentum .
With these technical indicators in alignment, the price has commenced its upward movement. The immediate profit target is set at the monthly pivot point of $51.51 , serving as the next significant resistance level. Traders should monitor these levels closely, as a sustained move above could further validate the bullish outlook for AVAX/USD.
In conclusion, the convergence of bullish divergence and a favorable MACD configuration offers a compelling case for an impending uptrend. Investors should consider these technical signals in their trading strategy, keeping an eye on the pivotal $51.51 level for potential profit-taking opportunities.

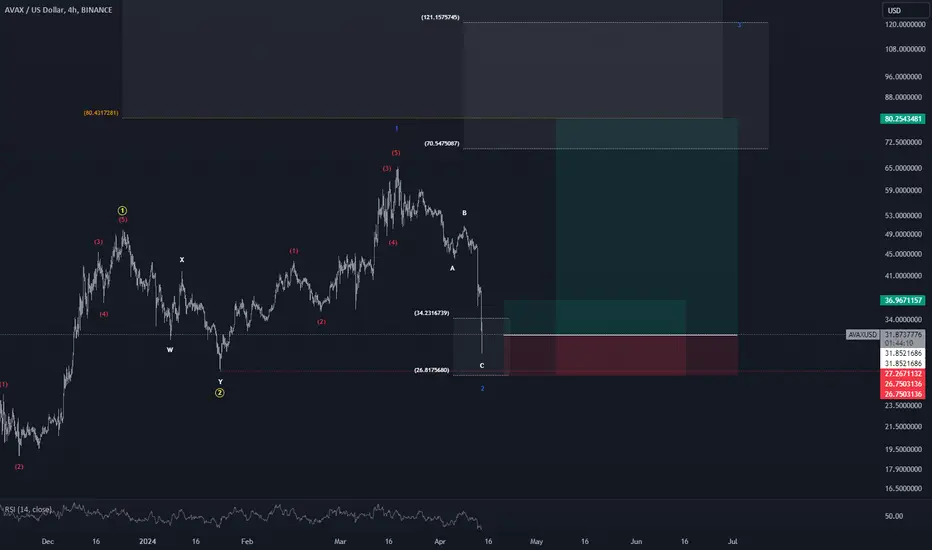
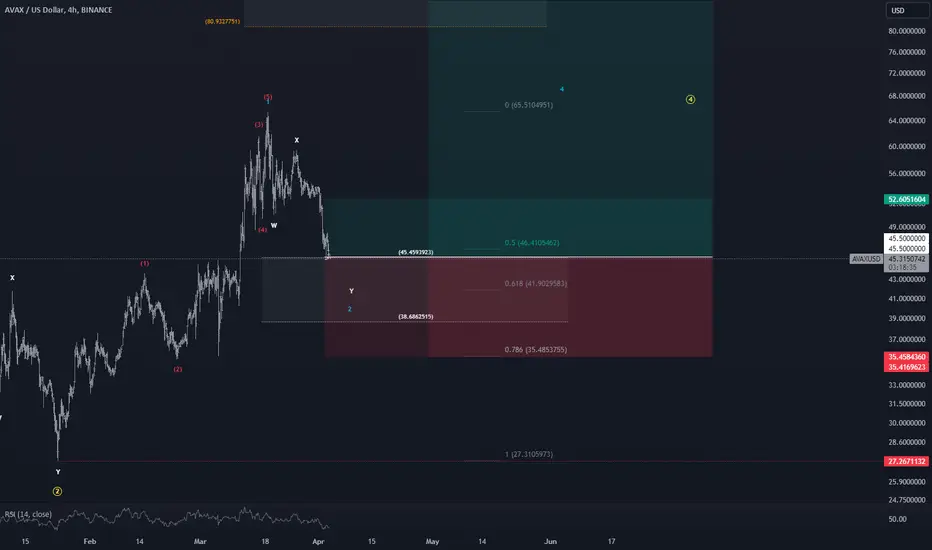
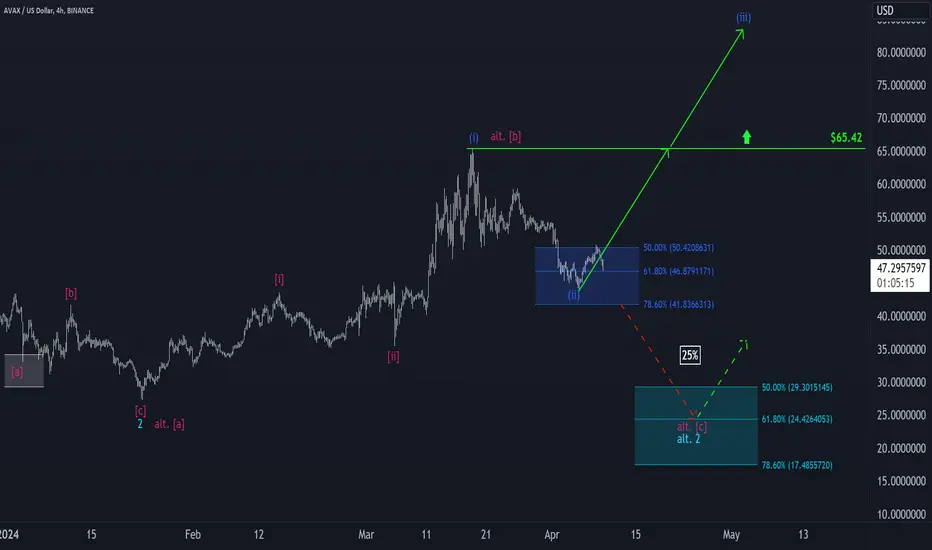
Avalanche: Take-off 🛫AVAX turned within our blue Target Zone ($41.83 – $50.42). Accordingly, we consider the low of the blue wave (ii) to be established. In the further course, the same-colored wave (iii) should continue well above the resistance at $65.42. Investors can open long positions in our Target Zone. Stops could be placed around 1% below the Zone. Indeed, if the price slips below the lower edge, this will activate our alternative scenario (25%). In this case, the price should drop to our turquoise Target Zone (between $29.30 and $17.48) to place the low of the turquoise wave alt.2.
Avalanche (AVAX) - Upside Breakout (April, 2024)Avalanche (AVAX) - has formed a bullish wedge pattern on the 4-hour timeframe, breakout to the upside past Resistance from a downtrend since: mid March 2024.
If a rally from the break pushes further forward to: "$65", then past it.. momentum will continue and AVAX could head higher at prices of: $70 once key level Resistance has been reclaimed.
‼️DISCLAIMER PLEASE READ CAREFULLY‼️
*(THIS NOT FINANCIAL ADVICE, ALWAYS DO YOUR OWN RESEARCH! I AM NOT RESPONSIBLE FOR ANY LOSS OF EARNINGS FROM ANY INVESTMENTS THAT YOU MAY MAKE BASED OFF ANY OF MY IDEAS. ONLY INVEST WHAT YOU CAN RISK TO AFFORD TO LOSE IF YOU MAKE THE DECISION TO DO SO. DO NOT INVEST, UNLESS YOU'RE PREPARED TO LOSE MONEY, IF NOT ALL.)
(CRYPTOCURRENCY CAN BE HIGH-RISK INVESTMENTS DUE TO THE VOLATILLITY OF IT'S NATURE, AND YOU SHOULD NOT EXPECT TO BE PROTECTED IF SOMETHING GOES IN THE WRONG DIRECTION. SEEK PROFESSIONAL ADVICE FROM A CERTIFIED FINANCIAL ADVISOR.)

AVAX we good?AVAX failed to hold above $50 looking for another support. I'm thinking down there around $42, $40 is fine too.

Avalanche Bullish Spring Avalanche Bullish Spring?
Falling wedge with potential to rise above $65,00.
Current price: $47,04
Marketcap: 10
Stoch Rsi = Bullish
Rsi = Neutral > Bullish
Macd = Neutral > Bullish

AVAX Buying Opportunity at 45 AVAX broke 50.50 and appears to be correcting.
We're eyeing an entry around 45.00 (100% Fib extension).
Aware of potential BTC/ETH pullback in a double correction impacting AVAX.
Target: 51.70 (T1) & 85.00 (T2).
Stop-loss: 34.80
Risk 1%

Sell AVAXNot longterm... just dabbling with trading at the moment. It's a clear and beautiful 1H breakout sell.

Avalanche (AVAX) Bearish Short TermAVAX is at a crucial level atm, $48 didn't hold Support. Be sure to watch out for this, because a break below could accelerate selling pressure and pull the pair to $42-$44 creating a new Level of Support.
Current Support Broken= $48
New Support Level= $42-$44
This short term bearish view will be invalidated in the near term if the price turns up and holds above the $50. AVAX price could rise to $60 and thereafter attempt a rally to the overhead major resistance at $65.

AVAXUSDso good sequence, what u see ?
share with me ur opinion,
in math I TRUST
be careful there is 2 demand zone .
will be updated if we have a change of character

AVAX/USD/AVALANCHE UPDATEDThe previous idea on last December price 47$ of CRYPTOCAP:AVAX and I am expecting to be redistribute after the 60$ but I was wrong about it, since the surge continues, Now the CRYPTOCAP:AVAX can clear this highs of 100$. But this idea is too speculative, I am not sure either if price can go there.
But this is crypto all things works once the public buying it. anyone here has the spot of 17$ a share last dip can still win or ride the 100$..
This is not a financial advice.
Only Gods and the dead can seem perfect with impunity""
