AVAX - Long idea VAX appears to be completing wave 5 from the lows. Wave 5 has already reached its minimum extension (inverse 1.236 of wave 4), but there is still potential for another leg higher before a larger pullback occurs. Move down from 45 still looking corrective.
Open @ 40.60
SL @ 38.15
Target 1 @ 42.25
Target 2 @ 48.40
AVAXUSD trade ideas

AVAX Leading DiagonalHello again
The King Of All TA Guys Is Here Again!
* Before you BS and say how come "wave 4 will go below 1" go read about diagonal wave first.
so as you see the avax finished 5 waves of the leading diagonal which represent the wave 1
so everything is mentioned on the chart
THANKS

AVAX Price Eyes $55 With The $40 Breakout Rally!Bullish Breakout at $40: AVAX price demonstrates a strong bullish trend with an impressive 89% rally in two weeks, breaking past the crucial $40 level.
Fibonacci Retracement Level in Focus: Avalanche's market price is eyeing the significant 38.20% Fibonacci retracement level at $54.59.
Weekly Chart Analysis: AVAX's recovery rally in the weekly chart marks a trend reversal, indicated by bullish engulfing candles.
Avalanche Network's Robust Growth: Data from DefiLlama highlights a recovery in the Avalanche network, with increases in total value locked (TVL), active addresses, and inflows.
Continuing Recovery: Despite a minor pullback in the 4-hour chart, AVAX maintains its upward trajectory, trading at $41.44 with an intraday growth of 4.52%.
Swing-High Breakout: AVAX's price action suggests a bullish attempt to push the rally further, potentially skyrocketing above the $55 mark.
Technical Indicators - RSI: The Relative Strength Index (RSI) indicates a temporary pause in the overbought zone, but a resurgence is likely.
Potential to Cross $50: AVAX shows active bullish sentiment, with a high possibility of surpassing the $50 level, particularly if the broader market improves.
Avalanche's Ecosystem Prospects: With the network ending 2023 on a high note and set for potential growth in 2024, there's optimism surrounding AVAX.
Critical Levels to Watch: The $55.49 mark stands as a significant target, with the potential retest of the $40 breakout level in case of a supply increase.


AVAXUSD (4H) - Bullish breakoutHi Traders
AVAXUSD (4H Timeframe)
The market is in an uptrend and we are waiting for an entry signal to go LONG above the 42.93 resistance level. Only the downward break of 34.05 would cancel the bullish scenario.
Trade details
Entry: 42.93
Stop loss: 34.05
Take profit 1: 48.40
Take profit 2: 57.28
Score: 9
Strategy: Bullish breakout

AVAXUSD $55.00 is on the cards but then expect correction.Avalanche (AVAXUSD) hit all of our targets during November's run (see chart below) and even broke above the 1W MA100 (green trend-line) for the first time ever:
This resembles the incredible rally of January 2021, even though it has been executed during a different time period of the global Cycle. Nonetheless, one last spike to the 1.786 Fibonacci to make a February 08 2021 type High, is expected (target = $55.00) but then most likely the market will correct back to the 1W MA50 (blue trend-line). After that, our long-term target will be 105.00 (Resistance 1).
-------------------------------------------------------------------------------
** Please LIKE 👍, FOLLOW ✅, SHARE 🙌 and COMMENT ✍ if you enjoy this idea! Also share your ideas and charts in the comments section below! This is best way to keep it relevant, support us, keep the content here free and allow the idea to reach as many people as possible. **
-------------------------------------------------------------------------------
💸💸💸💸💸💸
👇 👇 👇 👇 👇 👇

Scalp AvaxIm longing avax here it has been one of the stronger coins price dipped into a previous range then shot up and now is at new range lows stochastics is oversold and once price beaks above short term trend ema i will enter targeting range highs and beyond.

Avax Long Idea - Looks like an ABC. Let see if we can get a bounce from here
Open @ 38.60
SL @ 36.60
T1 @ 40.00
T2 @ 44.00

Avax to $100Looking at the way avax has been trending these past months. Avax is definitely hitting $100 by this coming March. BTC halving starting in April 2024, we will see the rest of the coins follow.
I am no expert. Just sharing my thoughts.

AVAX Pauses Before $40, A Halt Or A Reversal?300% Rally in Two Months: AVAX (Avalanche) displays an impressive 300% bullish rally in the last two months.
Struggle to Surpass $40: Despite the strong rally, AVAX faces challenges in crossing the $40 mark, hinting at a potential reversal.
Potential to Reach $56: If sellers lose dominance at $40, AVAX could potentially climb to $56.
Influence of Bitcoin's Bearish Mode: A bearish turn in Bitcoin impacts altcoins, including AVAX, which fails to surpass $40.
4.92% Pullback on Monday: AVAX experiences a 4.92% pullback, with a long-tail formation suggesting a possible bullish comeback.
Ending Consolidation in Weekly Timeframe: A significant rise in buying pressure ends the consolidation phase for AVAX.
Support from Avalanche Ecosystem: Growing network strength of the Avalanche ecosystem bolsters the AVAX price.
Current Trading Price: AVAX is currently trading at $35.23.
Technical Indicators - MACD: The MACD in the weekly chart shows a bullish divergence, supporting a continued uptrend.
Market Recovery's Impact on AVAX: Any market health improvement could spur a bull run in AVAX beyond $40.
Risk of Retesting $30: An increase in supply or bearish market trends could lead AVAX to retest the $30 level.

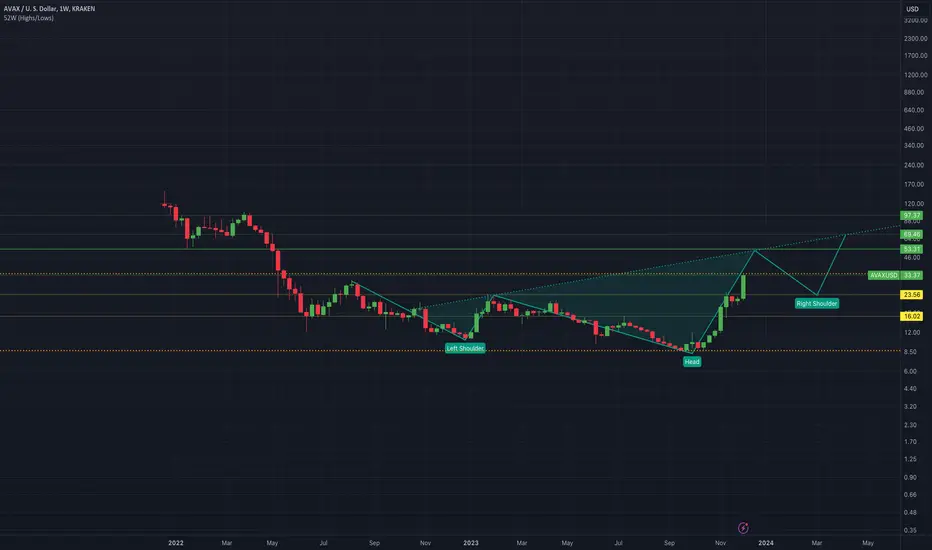
Avax confirming the log channel breakout.You can see on this log chart that Avax has confirmed a breakout above the yellow channel. On its way to the breakout target it has los broken above an inv h&s neckline. This is a very asymmetrical inverse head and shoulders pattern as we can see the right shoulder is extremely tiny and the head appears to be Siamese. All the same if this inverse head and shoulders pattern also validate the breakout target for it is around $56. *not financial advice*

3X Done. Going for 10X One of the best performers in this bottom run.
AVAX is still an undervalued market gift.
AVAX will do very well in the next bull cycle, NOW.
Avalance (AVAX) Bullish!$30 Was broken as a major level of resistance for AVAX. Next.. price movement will be heading towards the $43 mark! Re-test $43 area, then have a pullback continuing to the upside.

AVAX LONG OFF THE BOUNCEwill AVAX pull back to its previous resistance level and find support. I'm personally LONG here at 22.5. Leveraged at 30x 3% of account value looking for 1:2 but I like to close out manually.


AVAX lookin sharp guys 🔪🍽🎢In a realm where frost doth kiss the peaks so high,
Where mountains mighty cleave the azure sky,
There lies a tale, both grievous and profound,
Of an avalanche, whose fury knew no bound.
In a hamlet nestled 'neath the alpine crest,
Unaware of what would put their fate to test,
Sixty-three souls, in daily toil engaged,
Unknowing that their end was thusly staged.
From heights untold, with thunderous, fearsome roar,
Down came the snow, like Neptune's mighty oar.
In swift descent, it swallowed land and life,
Leaving naught but echoes of the strife.
But lo! The tale grows grimmer in its tell,
For destiny had yet a darker spell.
Two hundred fifty more, in path forlorn,
Were marked by nature's icy, wrathful scorn.
The avalanche, like Jove's unbridled ire,
Unleashed its cold with devastating fire.
It carved its way through hearth and home alike,
A tyrant king, none could dare to strike.
So heed this tale of nature's fickle hand,
That wields its power o'er sea, air, and land.
For in its wake, we find but sorrow's toll,
A reminder of our fragile, mortal role.
Let this story in our hearts be kept,
For those we lost, for those who wept.
In memory of the lives, it claimed that day,
We stand, we mourn, we hope, we pray.
KRAKEN:AVAXUSD

T-A AVAX$KUCOIN:AVAXUSDT. TEE AHHE
Why was the snowman searching through the carrots during the avalanche?He was picking his nose in the powder!

🌙 AVAXBINANCE:AVAXUSD
---
As we look to the horizon, there's a sense of anticipation, a whisper of something monumental on the verge of happening. AVAX isn't just breaking trends; it's setting a new standard, a rhythm that resonates with the pulse of the future.
The journey to $90 is more than just a financial milestone; it's a story of resilience, innovation, and the relentless pursuit of excellence. AVAX, in its essence, isn't just climbing a ladder; it's building its own, rung by rung, towards the skies of success.
In this dance of digits and dreams, AVAX isn't just moving upwards; it's inviting us to reimagine what's possible in the world of cryptocurrency. This is a moment for the bold, for those who see beyond the horizon, where AVAX isn't just a token, but a testament to the enduring spirit of progress.
And so, as AVAX charts its course towards $90 and beyond, it's not just carving a path in the crypto world; it's lighting the way for an industry on the brink of transformation. This is the story of AVAX, a tale of breaking barriers and soaring to new heights, where the only limit is the sky itself.

AVAX = 🌙 As we look to the horizon, there's a sense of anticipation, a whisper of something monumental on the verge of happening. AVAX isn't just breaking trends; it's setting a new standard, a rhythm that resonates with the pulse of the future.
The journey to $90 is more than just a financial milestone; it's a story of resilience, innovation, and the relentless pursuit of excellence. AVAX, in its essence, isn't just climbing a ladder; it's building its own, rung by rung, towards the skies of success.
In this dance of digits and dreams, AVAX isn't just moving upwards; it's inviting us to reimagine what's possible in the world of cryptocurrency. This is a moment for the bold, for those who see beyond the horizon, where AVAX isn't just a token, but a testament to the enduring spirit of progress.
And so, as AVAX charts its course towards $90 and beyond, it's not just carving a path in the crypto world; it's lighting the way for an industry on the brink of transformation. This is the story of AVAX, a tale of breaking barriers and soaring to new heights, where the only limit is the sky itself.

#Avax idea - chasing another push higherAVAX chasing another push higher:
Open limit 24.77
SL 23.63
TP1 25.55
TP2 28.00
Risk 1%

Avax breaking higherAVAX breaking higher in what could be wave 5 of 1 of the new bull market. The minimum target of wave 5 has already been reached (inverse Fibonacci extension of wave 4), but wave 5 can extend significantly. We will buy again on pullbacks.

Will AVAX Price Reach Escape Velocity To Cross $30?Boost Past $25: AVAX price surges beyond the $25 mark due to strong buying pressure.
16% Jump in Three Sessions: AVAX experiences a significant 16% increase within three trading sessions.
Potential to Reach $30: If the uptrend above $25 sustains, AVAX could potentially hit the $30 mark.
200% Growth in 50 Days: Avalanche has seen nearly 200% growth in the last 50 days, showcasing increasing demand.
Triangle Breakout Rally: A triangle breakout in the 4-hour chart indicates a return to bullish momentum.
Current Trading Price: AVAX is trading at $25.55, with a 4.07% intraday growth.
TVL and Volume Growth for Avalanche: Avalanche's Total Value Locked (TVL) and volume show a positive trend, indicating increased network adoption.
Technical Indicators - RSI: The RSI is in the overbought territory, suggesting strong demand without bearish divergence.
Possibility of Bull Run Beyond $30: Market recovery and network health improvements hint at a potential bull run to $36.
Risk of Retesting $25: There's a possibility of retesting the $25 level if faced with a supply wave.
Increased Liquidity in Avalanche Network: Growing liquidity in the network suggests more significant transactions and improved network health.
Escape Velocity for $30 Breakout: The combination of market recovery, network health, and technical analysis points towards an escape velocity for the $30 breakout.

Is AVAX Ready For A Hike To $30?Bullish Triangle Breakout: AVAX signals an imminent rally post a recent triangle breakout in the 4-hour chart.
Targeting $30: With resurfacing above $20, AVAX aims for a breakout rally targeting the $30 milestone.
Market Sentiment: Altcoins exhibit bullish continuation patterns, including AVAX, in preparation for a bullish December.
Uptrend Confirmation: Daily timeframe sustains AVAX's uptrend, reflecting opportunities for short-term traders.
Sideways Movement: November's failure to breach $25 results in a sideways gear, forming a triangle pattern in the 4-hour chart.
Underlying Demand: Despite the 4-hour cool-down, Avalanche sustains momentum with higher low formations, indicating strong demand.
YTD Performance: AVAX shows 100% YTD growth, remaining poised for a bullish December run.
Market Sentiments Boost: AVAX poised to leverage improving market sentiments for further bullish momentum.
