AVAXUSD trade ideas

Will AVAX Price Cross $25 Amidst High Volatility Waves?Sustained Trend Above $20: AVAX price maintains a position above the $20 mark, indicating a bullish trend continuation.
Golden Crossover and Bullish Sentiments: The golden crossover adds to the bullish sentiments, supporting the upward trend.
Potential to Cross $25 Resistance: If AVAX crosses the $25 resistance, it could reach a higher overhead resistance (specific value not provided in the text).
Strong Comeback Momentum: Avalanche demonstrates strong comeback momentum, consistently staying above $20.
Overnight Price Jump: AVAX experienced a 3.94% overnight jump, moving towards the $25 milestone.
Uptrend Continuation Prediction: The price prediction for AVAX suggests a continued uptrend for the remainder of 2023.
Unstoppable Bull Run: The bull run in AVAX price seems unstoppable, overcoming resistance levels one after another.
Increased Volatility and Trading Volume: Higher volatility is accompanied by bullish support in trading volume.
Current Trading Price: AVAX is trading at $22.42, following a 1.99% pullback after the recent jump.
Consolidation Range: AVAX is exhibiting a sideways trend, forming a consolidation range between $20-$24.
Technical Indicators: The daily RSI is near the overbought boundary, reinforcing bullish sentiment and supporting a breakout.
Potential Rise to $29.25: Post $25 breakout, AVAX could aim for $29.25, with a downside risk to $18 if it falls below $20.


Avax Long IdeaBught 3 waves back into 23.6% retacement from lows at 21.23
SL 20.00
TP1 21.88
TP2 26.00
Risk 1%
RR 2.2

AVAX vs ETHWe're near the lowest bound of the range of AVAX plotted against ETH. I think Avalanche will return to at least the highs of the range (and I feel very confident that we will move beyond the highs), which simply means for me that however long I am ETH I believe AVAX will do 5X better.
I think ETH could see at least a 5X of its own over the next couple of years and therefore I'd expect AVAX to put in at least a 25X from here.

AVAX Long IdeaAvax long
Open price @16.87
SL @ 15.40
TP1 @ 17.70 (half position)
TP2 @ 21.65 (half position)
Risk 1%
RR = 2

AVAX IdeasAVAX currently within the 50%-61.8% Fibonacci retracement zone from the 30.76 highs to lows. This area already provided downside momentum in recent days, now breaking higher, looks like it will not hold. Next upside targets are the 100% Fibonacci extension of the waves from November 9th to 12th at 23.27 and 100% Fibonacci extension of the waves from Oct 23rd to Nov 12th at 26.56

avax end of wavescurrently in wave 4 of 5 , possible triangle with breakout to around 25.
subsequent abc of wave 2 ideally to wave 4 of lesser degree around $16
nfa
y axis only

AVAX Price Ready To Cross The $25 Mark!Recent Price Action: AVAX has successfully retested the $16 breakout level, indicating a strong bullish momentum.
EMA Crossover: The 50-day Exponential Moving Average (EMA) is close to crossing above the 200-day EMA, signaling a potential bullish breakout.
Target Price: If AVAX surpasses the $20 mark, the rally could potentially boost its price to $22.
Significant Growth: AVAX has shown impressive performance with a 100% growth in the last 16 days, marking it as a top performer among blue-chip altcoins.
Positive Market Sentiment: The golden crossover in the EMAs is likely to enhance market sentiment around AVAX.
Recent Price Surge: AVAX experienced a 46% increase to $19.79 between November 10th and 12th, followed by a correction and a subsequent 5.79% jump.
Current Trading Status: AVAX is trading at $17.97, with a 5.40% intraday growth, reflecting strong market demand.
Technical Indicator - RSI: The Relative Strength Index (RSI) remains in the bullish overbought territory, supporting the ongoing uptrend.
Potential for Further Growth: With the bullish market conditions, AVAX is poised to cross the $20 threshold, with a possibility of reaching $25.
Downside Risk: A reversal before hitting $20 could lead to a price drop back to the $16 level.


AVAX/US DOLLAR These are levels that I'll be keeping an eye on when dealing with BINANCE:AVAXUSD , and I'll revise as price action progresses.
I adapt to the change in money flow.
Fundamentals:
Amazon Web Services (AWS) has partnered with Ava Labs in a bid to accelerate the adoption of blockchain technology by enterprises, institutions, and governments.
The move has sent the linked Avalanche AVAXUSD token soaring higher in recent days, outperforming even Bitcoin amid a major bull run in the biggest cryptocurrency. *OLD ARTICLE*
.....
Monthly:
1. P.A. broke a key low
2. Demand (untouched) below broken key low
3. Key S/R being revisited for 1st time
4. Key S/R rest within untouched demand

#AVAX $AVAX Expected Re-tracement#AVAX CRYPTOCAP:AVAX is Expected To Retrace Lower Before Any Further Highs.

Avalanche (AVAX) Bullish Wedge Pattern BreakoutBreakout from previous resistance level will spark a rally to try break above £25/$32 target level.
Chart shows AVAX was stuck in a bearish phase for over 460days, now is aiming for a prolonged recovery comeback with +40% within 1 week. Time to enter?
If a rally breaks through and momentum continues, AVAX could head higher and reclaim $55/£45 mark!

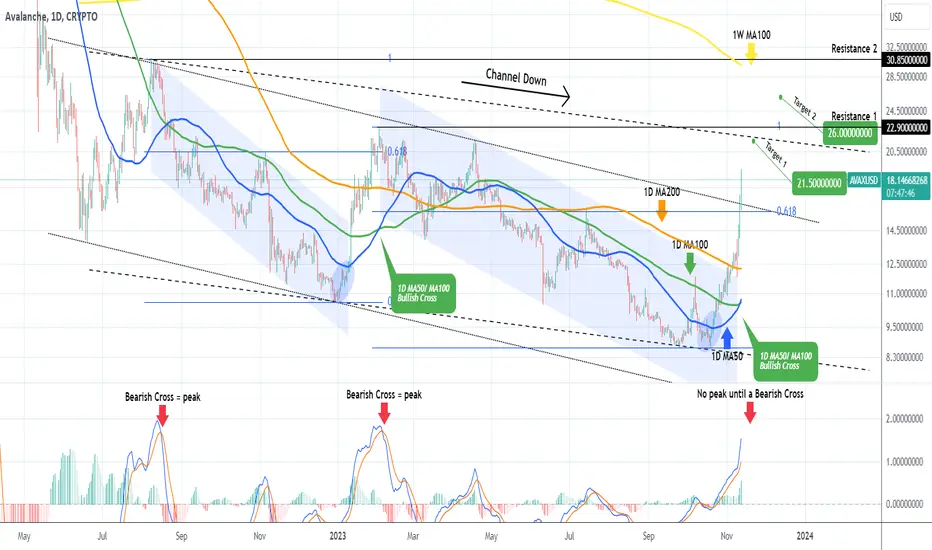
AVAXUSD Targets achieved. What's next?Avalanche (AVAXUSD) hit today our final (2nd) target of 15.5000 as we proposed on the bullish break-out signal we gave (see chart below) on October 04:
The question is, does this rally still have fuel in it or it will correct now? A reliable indicator in this case is the 1D MACD which, while the crypto has been inside the Channel Down pattern, it peaked both times just below 2.0000. This peak was confirmed only after a Bearish Cross. As a result, this rally still has room to go higher and the strongest Target (1) is the top of the top of the (dashed) final Channel Down that remains valid at 21.500. A break above Resistance 1 (22.9000) could also deliver a test of the 1W MA100 (yellow trend-line) at 26.000, but it is very doubtful to see a greater extension without a meaningful pull-back first.
-------------------------------------------------------------------------------
** Please LIKE 👍, FOLLOW ✅, SHARE 🙌 and COMMENT ✍ if you enjoy this idea! Also share your ideas and charts in the comments section below! This is best way to keep it relevant, support us, keep the content here free and allow the idea to reach as many people as possible. **
-------------------------------------------------------------------------------
💸💸💸💸💸💸
👇 👇 👇 👇 👇 👇

#Avax Long Idea Avax Long
Open price @ 11.48
SL @ 11.03
TP1 @ 11.81 (half position)
TP2 @ 13.20 (half position)
Risk 0.5%

Will AVAX Skyrocket To $15?Market Update: AVAX price rallies with a double bottom breakout, eyeing the $15 mark.
Current Trading Price: AVAX is trading at $12.07, with a slight intraday fall of 1.47%.
Key Resistance: The 200-day EMA and $12.34 level are the immediate resistances.
Technical Indicators - EMA: A golden crossover is on the horizon, indicating bullish momentum.
Technical Indicators - MACD: Shows linear growth with a bullish spread, suggesting continued upward movement.
Recent Pattern: AVAX formed a double bottom pattern, a classic reversal setup.
Potential Retest: A retest of $10.86 could occur before a further bullish trend.
Year-to-Date Performance: AVAX has turned Year-to-Date performance positive with a 12.60% gain.
Market Sentiment: The sentiment is bullish, with AVAX gaining 40% in the last three weeks.
Upside Potential: Crossing the 200-day EMA could significantly boost AVAX's price.
Downside Risk: A reversal from the 200-day EMA could see a drop to the $10.86 level.
Market Catalysts: Bitcoin's rise above $35K is creating a positive ripple effect for altcoins like AVAX.

Avax Long Idea
Open price @ 10.725
SL @ 10.34
TP1 @ 10.95 (half position)
TP2 @ 12.22 (half position)
Risk 1%

AVAX - The Hottest Entry in Whole CryptoHello Together,
AVAX seems to be repeating what it did in the previous bull cycle.
Forming a massive W Pattern, which has not broken out yet.
Last time this massive W pattern was formed we had a massive spike.
My Price Expectations:
October >12$
November >20$
End of Year +- 30$
I personally longed it at 10.56. Very confident in this setup, the general market has moved up quite a bit but AVAX simply did not yet, this is what we as traders or investors have to notice.
Eyes Open and Make Money.

SOL->AVAX Rotation trade, Point of maximum opportunityAVAX is now in the historic low of its range vs SOL and I've no information that Solana has somehow defeated Avalanche in terms of its value proposition, so it would make complete sense for there to be a rotation between the two platform tokens.
If you need fundamentals to drive a bullish position on AVAX, look at forthcoming blockchain games Shrapnel and Off the Grid, both very likely to be the biggest games in Web 3.0, also Avalanche appear to be courting RWAs and are said to appear in every conversation about asset tokenisation between the Big 4, see also Bank of America report on this.
All looking very good for Avalanche.

Is AVAX price ready to skyrocket to $15?Current Status: AVAX is trading at $10.99, experiencing an intraday growth of 4.56%.
Double Bottom Reversal: AVAX shows a double bottom reversal in the daily chart with a neckline at $11.
Technical Indicators - EMA: A bullish breakout above the 50-day EMA hints at a potential golden crossover.
Technical Indicators - RSI: The RSI shows a rounding reversal, re-entering the overbought zone.
Weekly Performance: AVAX has seen a dramatic rise of 26% over the past week.
Critical Resistance: The $11 mark has been a significant resistance level for AVAX.
Bullish Momentum: Seven bullish candles in the last eight trading sessions indicate strong bullish momentum.
Potential Targets: If the breakout is sustained, AVAX could reach $15, with a pitstop at $12.5.
Downside Risk: A reversal from $11 could see the price drop to $10.
Year-End Prediction: AVAX could potentially reach the $15 mark before 2023 ends.
Market Recovery: The overall crypto market is in a recovery phase, positively affecting AVAX.

AVAX/USD Ready to Breakout of 18 Month Downtrend on 1-Day ChartAvalanche (AVAX) has been trading below an 18 month down trend, and is ready for a breakout. There are several resistance levels between $10.80 and $12.00. Near term prices targets are $14.70, $17.05 and $20.60.

AVAX/USDT 1WAvalanche forms on the weekly time frame a big falling wedge pattern since June 22. Here are my 3 targets. I think #AVAX will explode soon.
