AVAXUSD ❕ price over liquidityAfter exiting the downtrend channel, AVAX formed an uptrend line while moving in the liquidity zone.
The price broke up through the 50, 100 and 200MAs on the 30m Timeframe.
I expect that after fixing above the support level, the price may continue to rise.
It's worth paying attention to volume growth because price just broke above the level.
AVAXUSD trade ideas

avax last chancewe are in a recession, we are in crypto winter. i will not be touching any alts. however i have a position in avax and will most likely hold on to it. this bullish bat is something to hold onto and really the last chance

How Can You Not Buy This???Literally been accumulating all the way down on levels that look key for a reversal - this is going to end up being one of the best macro longs in the market when it does exactly what ETH did from $100-4800~.

Becoming Dirt Cheap...Yes with the market we're in there can always be more downside but this is looking very good at these levels - I have been accumulating here.
AVAX SELL OFFAvax looks to be getting caught up with the Luna fiasco. LFG have a bag of avax that they are unloading on to the market. Look for the $40 mark to be broken and from there you can short and look for lower prices.
NFA
DYOR


AVAXUSD ❕ WAVES ScenarioContinuing the movement in the descending channel AVAX broke up 50MA at 30m Timeframe and tested the lower boundary of the channel.
The current behavior of the volumes is similar to how the volumes of trades on WAVES, which we reviewed in a recent idea.
In case the price fixes above the lower boundary of the channel, I expect a bounce to the resistance level.

AvalancheBreaking out of the triangle defines mid-term targets for the Avalanche.
Breakdown of the key support level $60.00, which is the point of intersection of the triangle trendline at D-1, is a strong signal for the continuation of the current trend. The target of $50.00 per coin will be a clear confirmation of the breakout of the key crossover. The support level at $50.00 looks technically confident for considering short and medium-term purchases within the descending channel with the target at $70.00-80.00. The subsequent potential break of $50.00 support opens technical targets for a test of $40.00 and key support at $20.00.

Approaching A Bottom Soon?It appears that this is in the process of finding a bottom - yes we can fall further down but this correction is looking near complete - not a bad time to start accumulating.

AVAX HAS BEEN TRADING WITHIN A DESCENDING CHANNEL. This asset has lost 2/3 of it peak value. But, is the fall in value over.
I hope we all learnt from this asset that FEAR OF MISSING OUT IS BAD. However, I am bullish LONGTERM.
SHARE YOUR THOUGHT, like, comment and follow

AVAX SHORT there is a saying that ALT's will melt faces... No doubt volatility will end of this quarter.

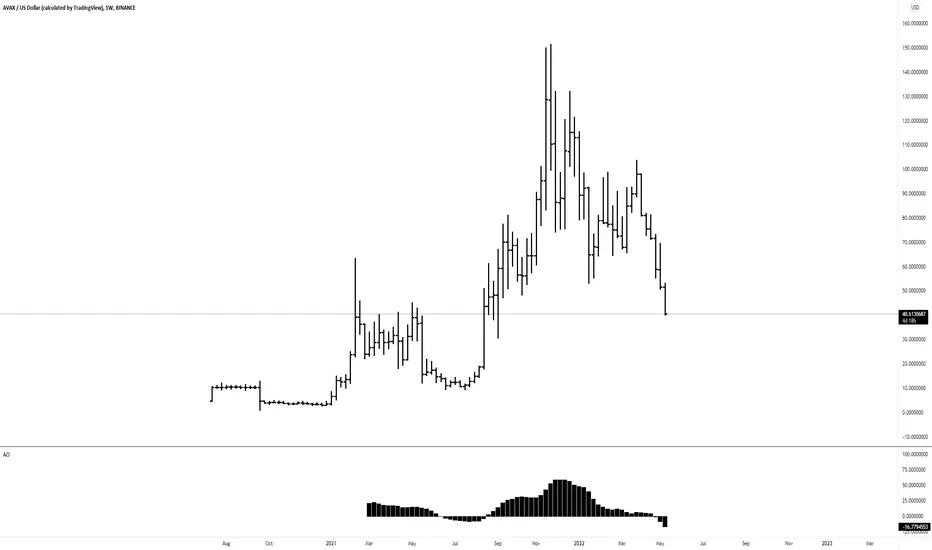
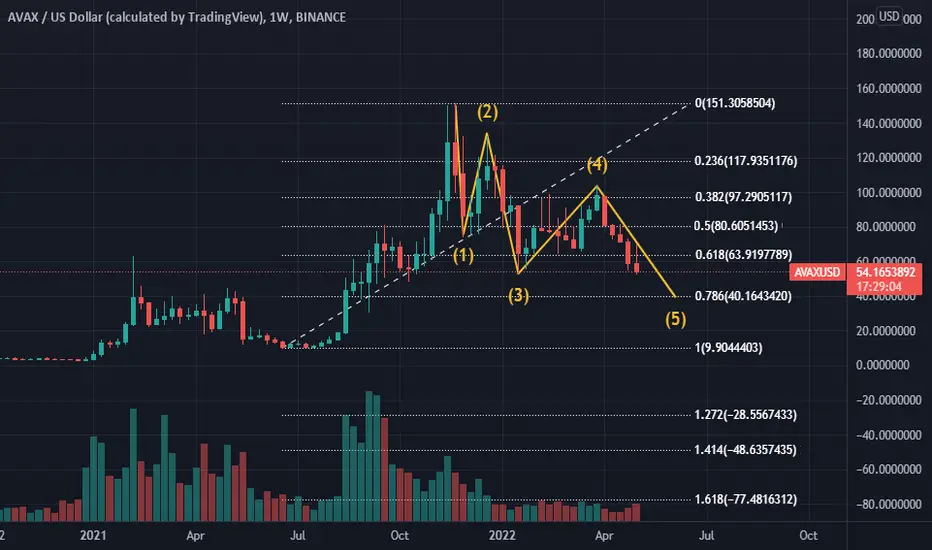
AVAX, 5 waves down.The following content is machine translation:
On the weekly chart, the current general trend is a downtrend. Showing a downward trend of 5 waves, it is currently in the 5th wave decline, and will continue to complete the 5th wave downward trend, and look at the support near 40.
AVAXUSD ❕ another liquidity zone50MA and 100MA crossed upwards of 200MA at the 30m Timeframe.
After reaching the liquidity zone, the price began a correction on declining volumes.
I expect that after fixing above the support level, the price will again move towards the resistance level.

AVAX ShortGoing for a hedge here on a weak altcoin. See how it goes gonna keep my eye out for bitcoin forming a support.

hold step by step watch the chart this is the best time for buy and hold ava if you see the sign then buy it dont be afraid

AVAX: Demand ZoneAVAX is about 60% down from the all time high in November. Currently, there is strong support between $46 to $60. This demand zone must hold and bounce above the main trend line for another bullish run up.

AVAX | CHANNEL SUPPORT LOSTChannel support is gone, so we can now expect a further downside in price action with horizontal support levels of 60 and 58 coming into play. Lets see

AVAX/USDT $500 ( 1500% ) Target in 2023 As per My Chart#AVAX/USDT Bullish chart Update:-
= $AVAX currently trading at $66
= Highly Potential to hit $500
= 2000% Up after first Accumulation zone.
= 1500% Up from 2nd accumulation zone.
= 1000% Expecting from the next Accumulation zone.
= The next Accumulation zone will be $35-$40
= Red Box RSI is the Perfect Entry zone.
= Expecting RSI will hit 30
= This time Breakout did but the Waiting for Retest level which is near $40
= Target will be $400+
Guys $AVAX is a Strong potential Project for Long Term.
I am accumulating at every Big Dip.
Please LIKE and Appreciate my Hard work.
Must follow me for the Latest real Time crypto Updates.
Thank you.

AVAX LONG 4.28No brainer long on avax.
Small bullish harmonic but price contraction means incoming volatility.
Day over day seller exhaustion. and target for retrace is at minimum 50% which is 5:1 R/R +22% / - 4.44%
Sure stop loss is tight but it can be 5% as well. I just like the golden ratio of 4.44.
{#AVAX $AVAX #AVALANCHE}

AVAXUSD ❕ range and channel crossingAVAX is moving in a downward channel, but still holds the lower zone of the trading range.
During the fall, trading volumes were decreasing.
I expect a further decline when the price fixes under the zone.

Avalanche: Baby One More Time! 🎤Britney Spears’ voice seems to sound in the background, singing “Hit me, Baby, one more time”, while Avalanche approaches the orange zone between $70.58 and $58.31 one more time. We expect it to dive into the orange zone to finish wave C in green and wave ii in orange. Afterwards, Avalanche should rise upwards more sustainably, crossing the resistance at $98.77 in the process. In addition to Britney’s song, we should keep in mind, though, the 35% chance that Avalanche could drop through the orange zone and fall below the support at $53.16.

AVAX USD RALLY RETRACE PART 22 Bullish targets at resistant levels 100 and 120 possibly all time high 1.47 plus.
Big retrace after ATH or resistance levels with further continuation of wave 2 to 1.618 Fibonacci Support.
This is where investors will or should after the sell off get in for the Proof of Stake project to really build up the stock for APY HODLing.
This will be a very long consilidation of support, there are only 270 mill in supply, aprox. double ETHs Ciculating Supply
This project has potential but there will be big losses for the early buyers if they dont sell off, competition for these AVAX will be huge and low cost purchase is smart money.

AVAXUSD close to starting a rally to $250.00Avalanche (AVAXUSD) has been trading below the 1D MA50 (blue trend-line) for the past week, ever since the pull-back from the April 02 High. Even though that rattled the confidence of many market participants, there is no cause for concern as this was a short-term profit-taking correction within the larger Rising Wedge pattern on the long-term.
The coin is coming off an Accumulation Phase similar to those of June - July 2021 and October - December 2020. The 1W MA50 (red trend-line) has been supporting for the past 8 months and the 1D LMACD is approaching a Bullish Cross formation. This is a bullish indicator mix, familiar with the previous Rise phases that led to Higher Highs on the Rising Wedge.
The next Higher High is expected to be close to the 1.5 Fibonacci extension. We set a $250.00 long-term target on AVAX.
--------------------------------------------------------------------------------------------------------
** Please support this idea with your likes and comments, it is the best way to keep it relevant and support me. **
--------------------------------------------------------------------------------------------------------
