AVAX I 3M CLS Range I Model 1 I 50% partial full range potentialYo Market Warriors ⚔️
Fresh Crypto Analysis— if you’ve been riding with me, you already know:
🎯My system is 100% mechanical. No emotions. No trend lines. No subjective guessing. Working all timeframes. Just precision, structure, and sniper entries.
🧠 What’s CLS?
It’s the real smart money. The invisible hand behind $7T/day — banks, algos, central players.
📍Model 1:
HTF bias based on the daily and weekly candles closes,
Wait for CLS candle to be created and manipulated. Switch to correct LTF and spot CIOD. Enter and target 50% of the CLS candle.
For high probability include Dealing Ranges, Weekly Profiles and CLS Timing.
Analysis done on the Tradenation Charts
Disclosure: I am part of Trade Nation's Influencer program and receive a monthly fee for using their TradingView charts in my analysis.
Trading is like a sport. If you consistently practice you can learn it.
“Adapt what is useful. Reject whats useless and add whats is specifically yours.”
David Perk aka Dave FX Hunter
💬 Comment any Coin I ll give you my quick view
AVAXUSDT trade ideas
AVAX | Full Analysis Here is the top-down analysis for AVAX as requested 🫡
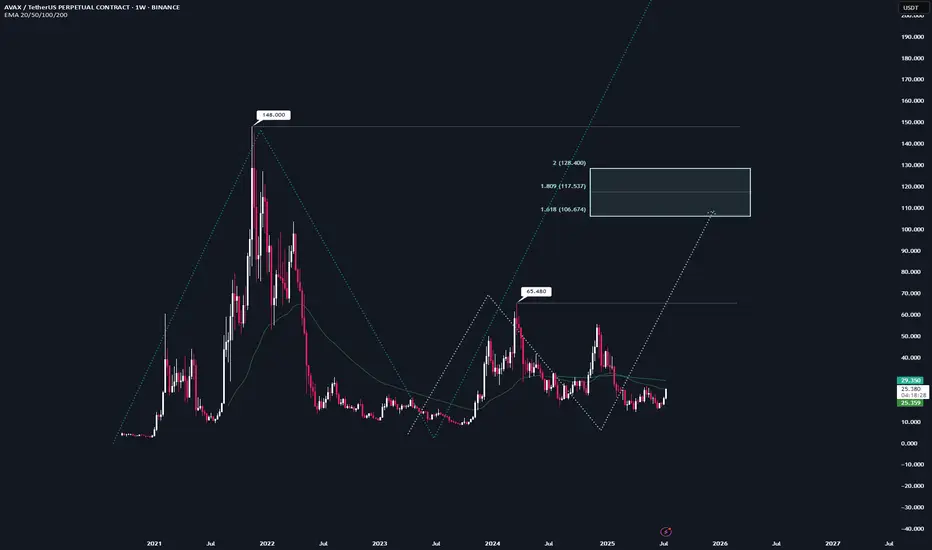
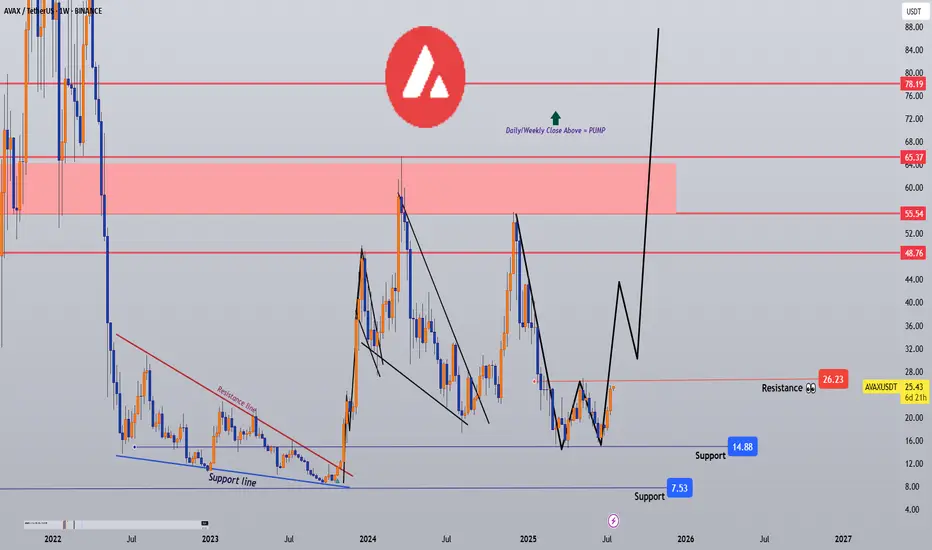
Weekly Timeframe:
We currently have two potential bullish structures on the weekly chart, but neither has been activated yet.
The first one (light turquoise) will be activated once we break the local high at $65. Until then, there's no valid trade setup. This sequence has it target range at $106–128.
The second structure (turquoise) gets activated once we break the all-time high at $148. It then targets the $242–298 range, which also represents my conservative bull run targets for $AVAX.
On the weekly chart, the strategy is to HODL. I wouldn't buy at this point, and I definitely wouldn't sell—because if we see another altcoin season (which in my view is nearly guaranteed), there's no reason AVAX shouldn't reach its targets around $242.
I would personally start taking profits at $106, then again at $148, and be fully out at $242.
Daily chart:
Here we have a potential structure that will be activated once we break the recent high at $26.
From that point on, according to the rulebook, every pullback into the B–C correction level (Fib 0.5–0.667) becomes a tradable opportunity.
Local Priceaction:
Three days ago, we successfully broke through the bearish reversal zone (red) and reached the bullish target zone (turquoise).
Now, every pullback into the B–C correction area becomes a valid long entry. If the price turns around and reaches that area again, I’ll trade each level with a stop-loss just below the next key level.
--------
Thats the my full Analysis for CRYPTOCAP:AVAX , hope it was helpful if yall have anymore questions feel free to ask, and if you want me to do another analysis for any other pair just comment down below.
Thanks for reading❤️
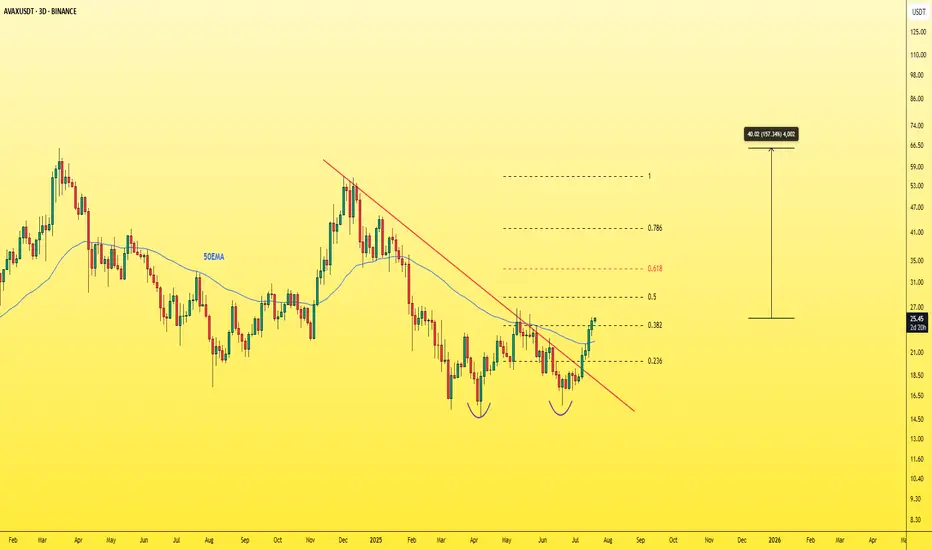
AVAXUSDT - THE real treasure must be hunted!Let's not forget about CRYPTOCAP:AVAX — it's one of the must-have assets in any crypto portfolio.
Currently trading at a discounted price after dropping from its previous top at $55, AVAX now shows strong bullish potential with plenty of upside ahead.
🚀 Key bullish signs:
-Successfully broke through multiple resistance levels, including the 0.382 Fibonacci retracement, 50 EMA, and the main descending trendline.
-A daily close above the 26$ level is a very positive signal.
With a solid project, reliable fundamentals, and low risk compared to potential reward, this could be a highly profitable opportunity.
Don’t sleep on it.🎯
Avalanche's (AVAX) $229 & $363 Bull Market Potential ExposedStarting from the December 2020 low, Avalanche (AVAX) grew a total of 5,245% to its November 2021 all-time high. Now, if we take the true market bottom, when trading started back in September 2020 with a low of $0.85, total growth by the end of the bull market amounts to 17,152%.
It doesn't matter how you slice it, both are incredibly strong numbers.
Do you really think Avalanche will consolidate for years only to grow 500%, 600% in its bull market? I don't think so. This prolonged consolidation period was a test. Those that remained true to the market; those that continued to hold; those that continued to develop, to build and to grow within the market; all those people will be rewarded, big time.
Let's consider the true potential for AVAXUSDT in early 2026 or late 2025.
The main target is $229. I think missing a new all-time high is out of the question. We are going for the top as the market has been growing behind the scenes for so long. So much hard work has gone into making Cryptocurrency accessible to everybody and this hard work is about to pay off.
This $229 target opens up 880%. Keep in mind that this coming from current prices. If we were to consider the bear market bottom, this number would be much higher, something around 2,564%.
The next target, a "strong all-time high," is open at $363. This would give us a total profits potential of 1,450%.
As you can see, Avalanche is trading at bottom prices with plenty of room left available for growth. It is still very early if you focus on the long-term.
Thank you for reading.
Your support is appreciated.
Namaste.

Avalanche corrected from resistance ┆ HolderStatBINANCE:AVAXUSDT broke below $27.6 and is testing $25.9. Breakdown may open $24.5. Bears remain in control.
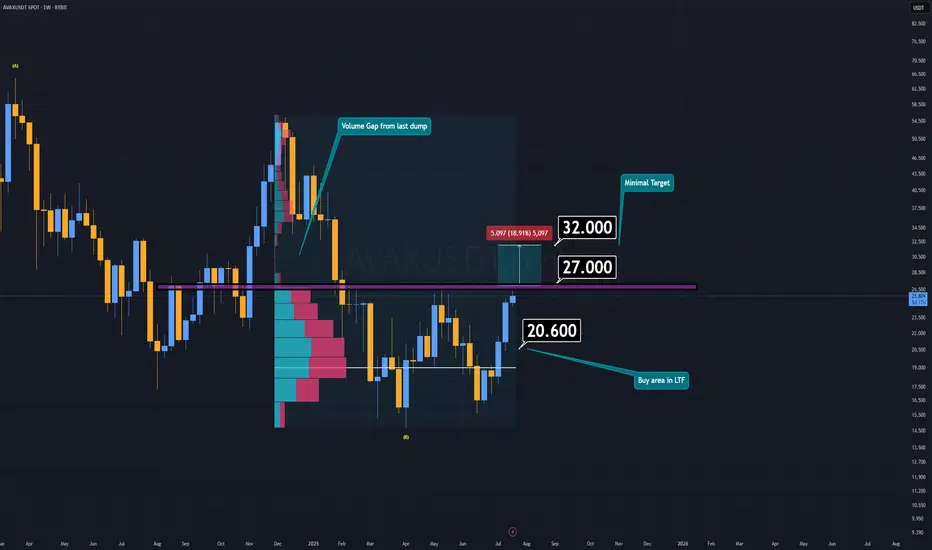
AVAX Analysis (1W)AVAX is currently attempting to form a double bottom pattern, which could signal a strong bullish reversal if confirmed. Earlier this week, AVAX made an effort to break down the key support/resistance zone, but it lacked the necessary volume to succeed.
If AVAX manages to reclaim the resistance area around $27 or higher, and confirms the breakout with a daily candle retest, the minimum target sits at $32.
However, if AVAX fails to break through resistance, there’s potentially an even better buying opportunity in the lower timeframes—a demand zone between $20 and $20.6.
I believe altcoins will offer another chance to catch up while prices are still far below their future valuations.
-S Wishes you the best in luck.
AVAX Long Swing Setup – Waiting for Support RetestAVAX has been rallying for two straight weeks, showing strong momentum. We’re watching for a healthy pullback into the $22.50–$24.00 support zone to position for continuation. If this zone holds, the risk/reward setup favors bulls with clear upside targets.
📌 Trade Setup:
• Entry Zone: $22.50 – $24.00
• Take Profit Targets:
o 🥇 $27 – $29
o 🥈 $33 – $35
o 🥉 $40 – $44
• Stop Loss: Daily close below $20.50
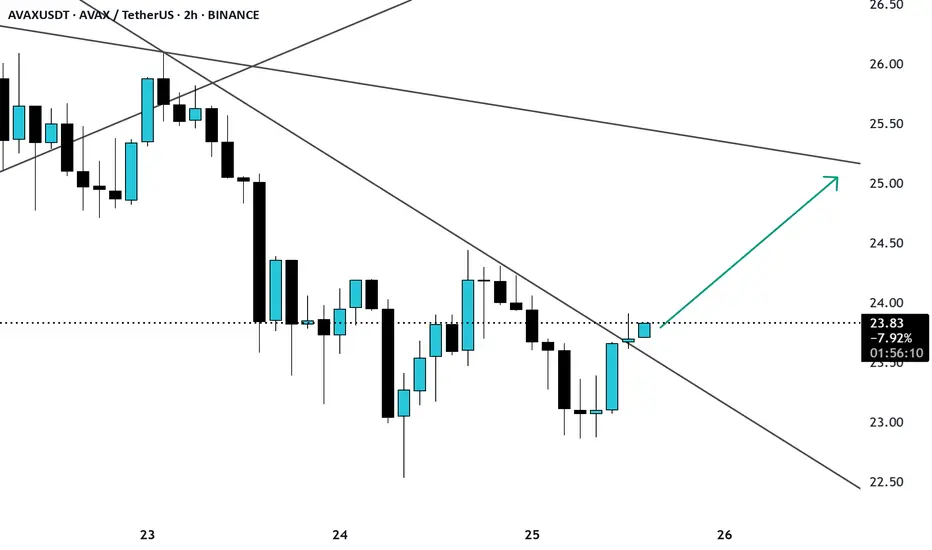
AVAX break of trendline resistance AVAX/USDT is showing a strong breakout attempt on the 2H timeframe, breaking above a descending trendline after multiple rejections from the $23.00 zone.
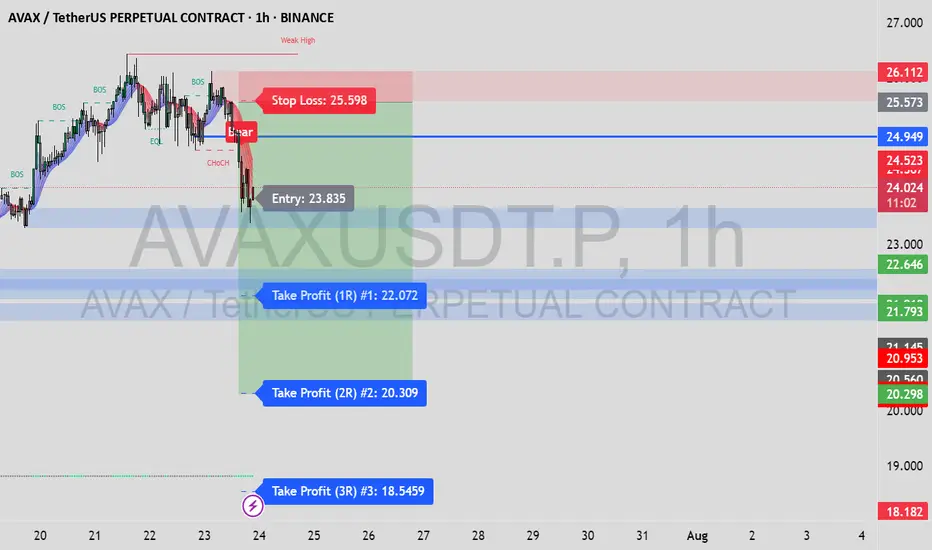
AVAXUSDT.P – High-Risk/Reward Short Setup | Smart Money Play (1H📉 AVAXUSDT.P – High-Risk/Reward Short Setup | Smart Money Play (1H)
🔍 Trade Type: Short
🕐 Timeframe: 1-Hour (1H)
📊 Entry Trigger: Change of Character (CHoCH) after Equal Highs
🎯 Target: 20.298
🛑 Stop Loss: 25.573
💰 Risk/Reward Ratio: 9.79
📌 Trade Breakdown:
This AVAX short was taken based on Smart Money Concepts, using a combination of liquidity structures and market psychology:
✅ Key Confluences:
Equal Highs (EQL) formed above internal structure – clear inducement/liquidity pool.
CHoCH confirmed as price broke below a major internal low → bearish intent confirmed.
Retracement into Bearish Order Block in the Premium Zone offered an optimal entry.
Strong follow-through from institutional selling after liquidity grab.
🧠 Why I Took This Trade:
This setup offered a clean narrative:
Liquidity above = taken
Internal structure = broken
OB in premium = respected
Imbalance/fair value gap below = price magnet
This alignment made it a high-confluence short with an excellent R:R ratio.
🎯 Target Zone (20.298–20.953):
This area contains unmitigated demand and prior support. I anticipate price to:
Tap into this zone to rebalance price inefficiency
Potentially react from there (watch for reversal setups)
⚠️ What I'm Watching:
Possible reaction around 21.793 support – consider partial profits
Maintain awareness of higher timeframe trend (H4/D1)
Volume shift or bullish CHoCH may signal exit before TP
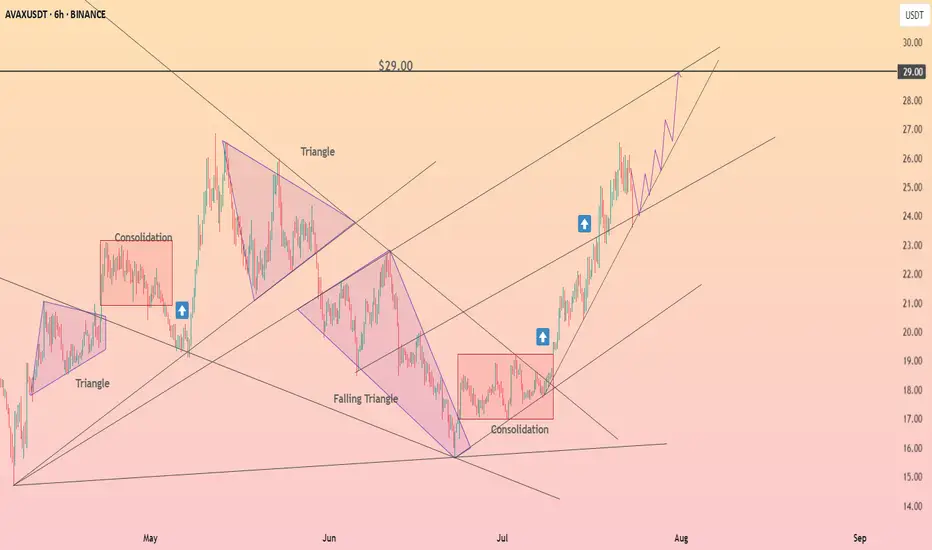
AVAX USDT BreakoutsAvax breaking out of multiple resistances and triangle patterns. Very strong bull action up ahead.

#Avalanche (AVAX) Setup | Can Subnets Ride the ETF Wave?📌 Coin: AVAX (Avalanche)
💰 Buy Levels:
✅ First Entry: $25.00
✅ Second Entry: $22.00
✅ Third Entry: $19.00
🛑 Panic / SL Level: Weekly close below $17.00
🧠 Fundamental Analysis (FA) – In Short
*️⃣ Sector: Layer 1 / Modular Smart Contract Platform
*️⃣ Use Case: Avalanche is a high-performance blockchain enabling scalable, low-latency dApps, tokenized assets, and Web3 games through custom subnets.
*️⃣ Tech: Uses Avalanche consensus across three chains (X/P/C), delivering near-instant finality, sub-second transaction speed, and flexible design.
*️⃣ Narrative Fit: Strong narrative alignment with RWA (Real World Assets), Web3 Gaming, and future ETF inclusion due to institutional activity.
*️⃣ Enterprise Adoption: Already used by JPMorgan pilot programs, Citi, Deloitte, MasterCard, and more — making it one of the few real-world-tested chains.
*️⃣ Unique Angle: Subnets allow permissioned chains, native gas tokens, and fully custom blockchains — ideal for both DeFi and enterprise.
📊 Tokenomics & Market Data
(As of July 2025)
🪙 Current Price: ~$23.30
🧾 Market Cap: ~$9B
🔢 Rank: Top 15
🧮 Circulating Supply: ~395M AVAX
🔒 Max Supply: 720M AVAX
🔥 Deflationary Mechanism: AVAX burn from fees, reducing long-term supply
🛠️ Validator Rewards: Distributed through staking + subnet usage
🎯 Bull Market Target (Realistic)
Target Range: $48 – $65
*️⃣ Based on prior cycle resistance, subnet growth, and DeFi/gaming recovery.
🚀 Mega Bullish Target (Speculative Top)
Target Range: $95 – $135+ $200
*️⃣ Avalanche is at the front of RWA tokenization, already powering platforms like Intain, and involved in enterprise pilots with Citi, JPMorgan, and Mastercard.
*️⃣ If RWA becomes the core crypto narrative, Avalanche’s modular subnet design could drive institutional adoption at scale.
*️⃣ While not yet in ETFs, its technical credibility + enterprise presence makes it a top candidate for future L1 ETF exposure or crypto asset baskets.
*️⃣ Combine institutional flow + Web3 gaming + subnet scaling, and you get a realistic path to triple-digit price discovery.
✅ Final Take
🧠 Avalanche is a technically mature Layer 1 with real-world traction and modular scaling via subnets — giving it strong utility and upside.
we ask Allah reconcile and repay
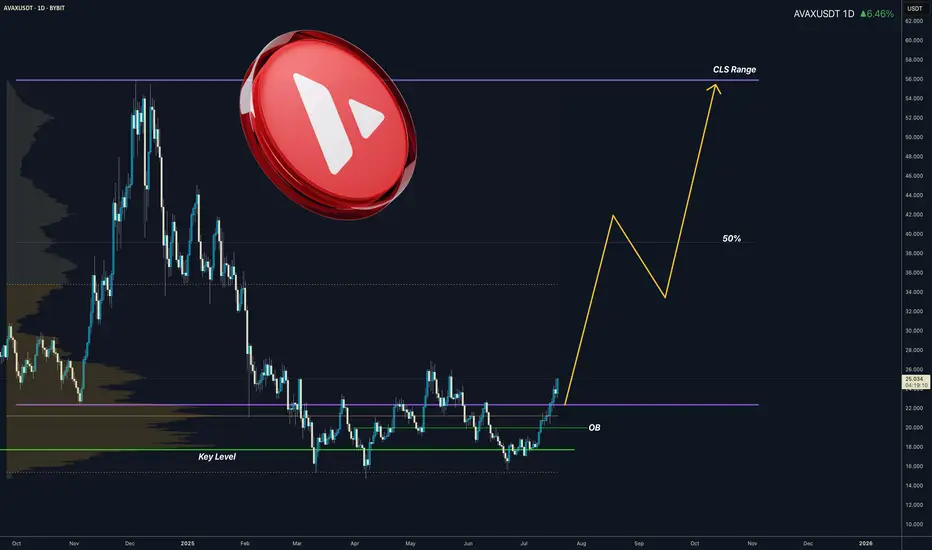
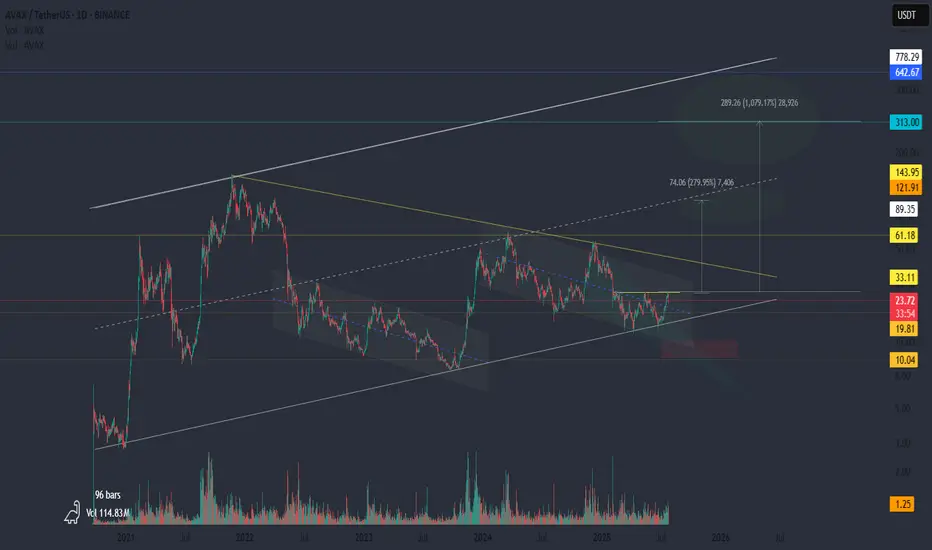
AVAX: A Quiet Rocket?This might be the calm before the cycle.
📍 All the liquidity is above.
Levels like 33 and 61 aren’t just resistance — they’re fuel. Clusters of short liquidations and forgotten limit orders are sitting right there. If we get a breakout, it could be sharp. And if there’s another pullback? Don’t panic. That would be the test — the shakeout before the move.
🚀 If the cycle kicks in, AVAX could be one of the silent leaders.
While the crowd is focused elsewhere, AVAX has been building quietly: structure, accumulation, time. The kind of setup that doesn’t scream hype, but whispers opportunity.
$AVAX Bullish Flag Target will be $310 (12X from here!)Bullish double bottom makes the reversal structure clearer.
After breaking the channel the first target will be the previous ATH and the next will be 1.272 of fibo which is around $310!

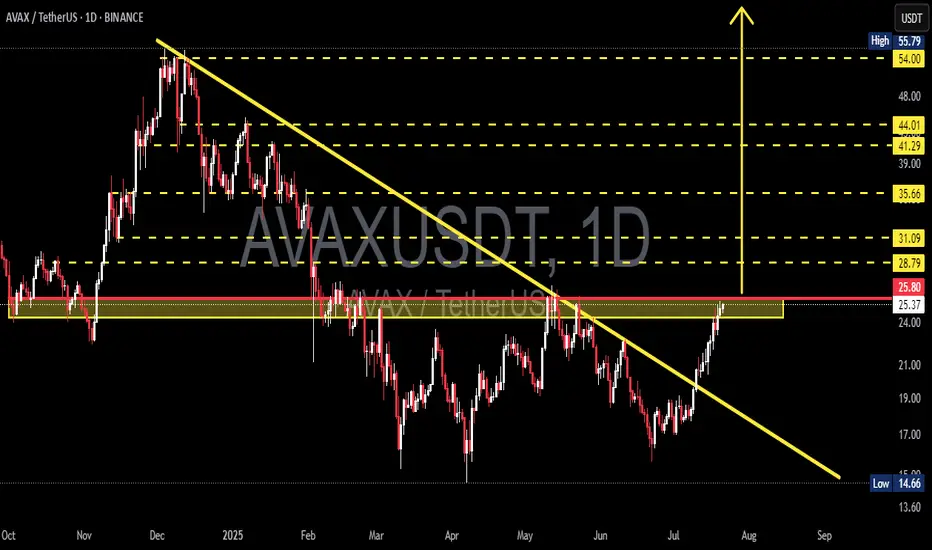
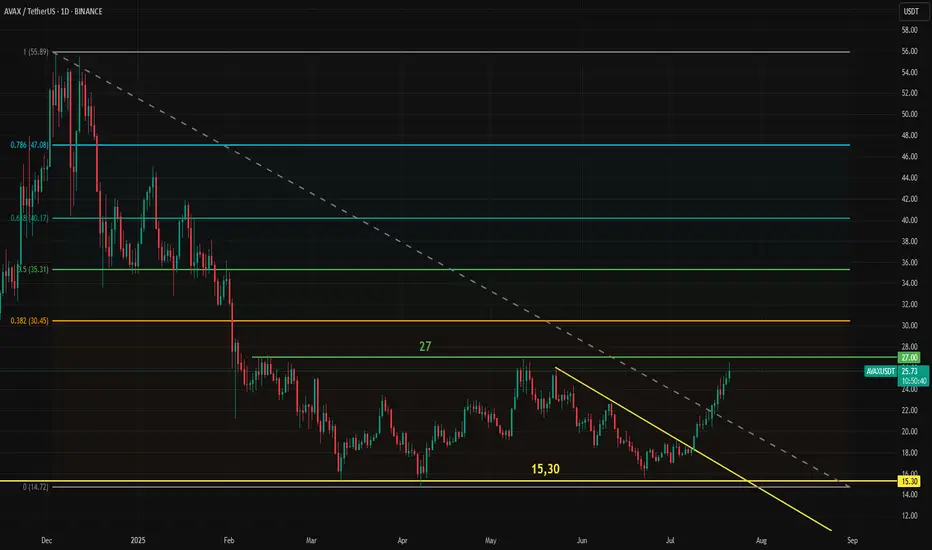
AVAX/USDT Massive Trend Reversal: Breakout from 8-Month DowntrenAVAX has just delivered one of its most technically significant moves in recent months. After spending over 8 months trapped under a descending resistance line, price action has finally broken free — suggesting a potential trend reversal and the beginning of a much larger bullish phase.
🧠 Pattern & Structure Breakdown:
📌 Descending Trendline Breakout
AVAX had been forming a descending triangle pattern, characterized by consistent lower highs and a horizontal support zone between $14.66 – $22. The recent bullish breakout from this structure, accompanied by strong volume, is a highly encouraging sign for bulls.
📌 Accumulation Zone Identified
The yellow zone on the chart ($14.66 – $22) has proven to be a strong demand zone where buyers consistently stepped in. The recent rally originates from this base, indicating possible institutional accumulation.
📌 Critical Horizontal Resistance at $25.80
Price is now testing the $25.80 resistance zone, which historically acted as a supply area. A successful daily close and confirmation above this level would officially flip the structure bullish.
📈 Bullish Scenario – Multi-Level Upside Targets:
If AVAX confirms the breakout above $25.80, these are the key bullish targets ahead:
🎯 Target 1: $28.79 – minor resistance & potential short-term TP zone
🎯 Target 2: $31.09 – previous price equilibrium
🎯 Target 3: $35.66 – key pivot from past market structure
🎯 Target 4: $41.29 and $44.01 – heavy historical supply zones
🎯 Target 5 (measured move): $54.00 to $55.79 – the projected breakout target from the descending triangle pattern
This move would represent a full technical recovery if AVAX aligns with broader market sentiment and Bitcoin remains stable or bullish.
📉 Bearish Scenario – Pullback Risks:
On the flip side, if price fails to sustain above $25.80 and gets rejected:
⚠️ A retest of $24.00 – $22.00 is likely
⚠️ If that zone breaks down, next support lies at $19.00 – $17.00
⚠️ A loss of the $17 level may trigger a return to the critical low near $14.66
This would invalidate the bullish breakout and return AVAX into a sideways or downward consolidation phase.
🔍 Additional Technical Insights:
✅ Volume is steadily increasing — showing renewed buying pressure
✅ Indicators like RSI and MACD (if applied) are likely showing bullish divergence
✅ Overall altcoin sentiment is improving, providing a tailwind for AVAX's potential breakout continuation
🧩 Final Thoughts:
AVAX is at a pivotal moment in its medium-term price structure. The breakout above the long-term downtrend line is a strong technical shift. A confirmed breakout and hold above $25.80 could trigger a multi-week or multi-month rally targeting $40 – $55+.
However, traders should be cautious of possible pullbacks and manage risk accordingly — especially as resistance zones from previous structures are being tested.
#AVAX #AVAXUSDT #CryptoBreakout #TechnicalAnalysis #Altcoins #BullishCrypto #DescendingTriangle #ReversalPattern #AVAXAnalysis
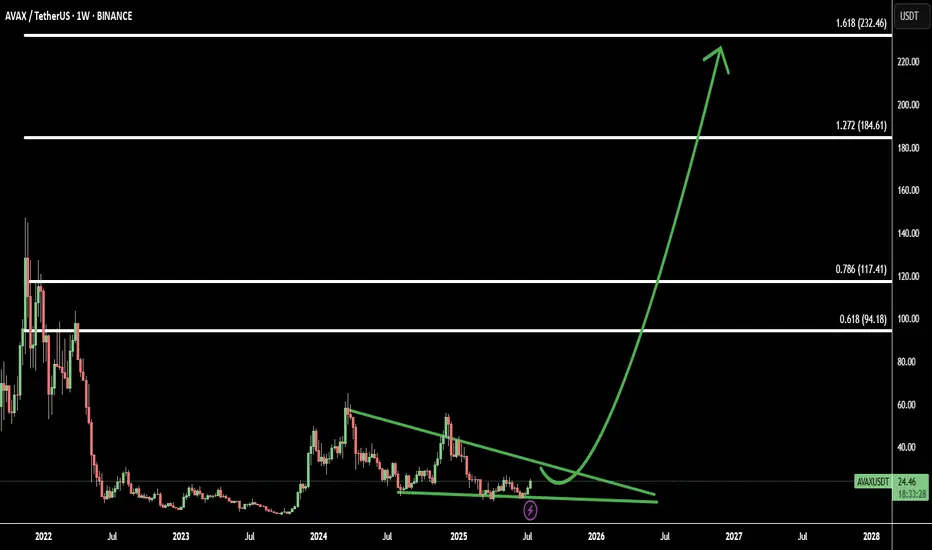
AVAX Breakout from Falling Wedge: Tracking 4 Fibonacci TargetsAvalanche (AVAXUSD) has broken out of a falling wedge pattern on the weekly timeframe, signaling a potential shift from bearish consolidation to a bullish continuation phase. The breakout is a strong technical signal often associated with trend reversals.
Using Fibonacci extensions from the breakout base, I’ve mapped out 4 critical target levels:
Target 1: 0.618 Fib – first major resistance after breakout - 94.18
Target 2: 0.786 Fib – deeper retracement and strong reaction zone - 117.41
Target 3: 1.272 Fib – full extension, potential profit-taking point - 184.61
Target 4: 1.618 Fib – aggressive upside target for extended rally - 232.46
These levels align with historical price structure and may act as magnets for bullish momentum if volume confirms the breakout.
Avax Tests Key Resistance at 27 for the Third TimeAvax is once again testing the 27 resistance level. The first attempt lasted over a week, and the second one held for a couple of days, but in both cases, Avax failed to break through. This time, however, it has stronger support from market-wide momentum.
Bitcoin has reached 120,000, Ethereum is posting sharp gains, and most notably, Chainlink (LINK) has already broken through its own resistance. Avax and LINK have shown a high degree of correlation, nearly 89% over the past two months. This strong relationship, while occasionally fluctuating, has been in place for several years.
A breakout for Avax may take time, but it now has more momentum and supportive conditions behind it. Still, as long as the 27 resistance holds, bulls should approach with caution before entering long positions.
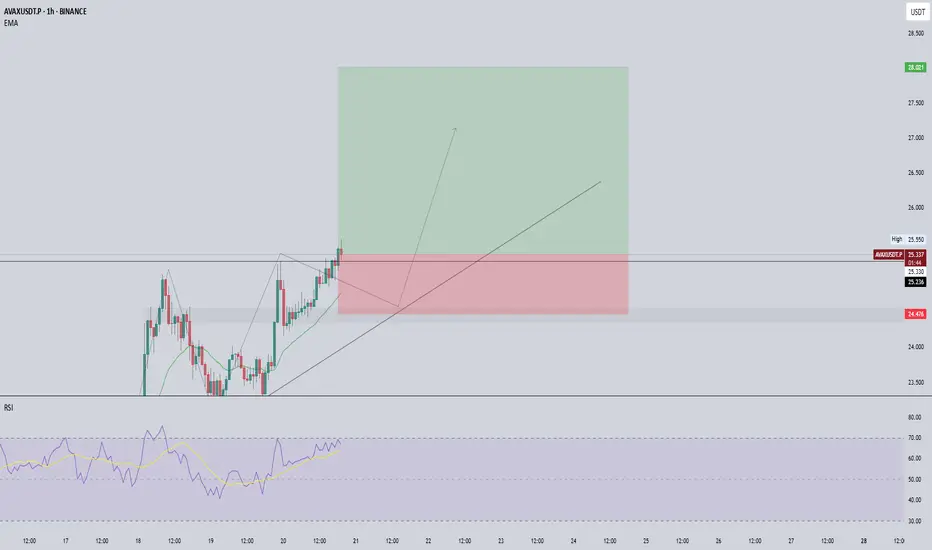
AVAX/USDT Trade Setup (1H Timeframe)🚀 AVAX/USDT Trade Setup (1H Timeframe)
Just entered this trade earlier around 25.03 USDT after seeing good momentum build-up.
Support zone I’m watching: 24.30–24.45, aligned with 1H EMA
Resistance area: 28.00, but I'm locking partials near 26.50 in case it slows down
RSI was still comfy at 66.99, not yet overbought
Volume steady, candles pushing clean = signs of strong trend continuation
Stop loss is at 24.676 for safety if momentum shifts.
📌 Plan:
Trail my stop behind swing lows
Watch RSI — if it hits 80+, I’ll start scaling out
Targeting 2.1 RR ratio, just keeping it consistent
This is not a hype play — price broke structure and retested properly. If volume stays solid, I’m letting it run.
This isn’t financial advice — just sharing what I’m seeing.
**Risk Management First – Not Financial Advice**
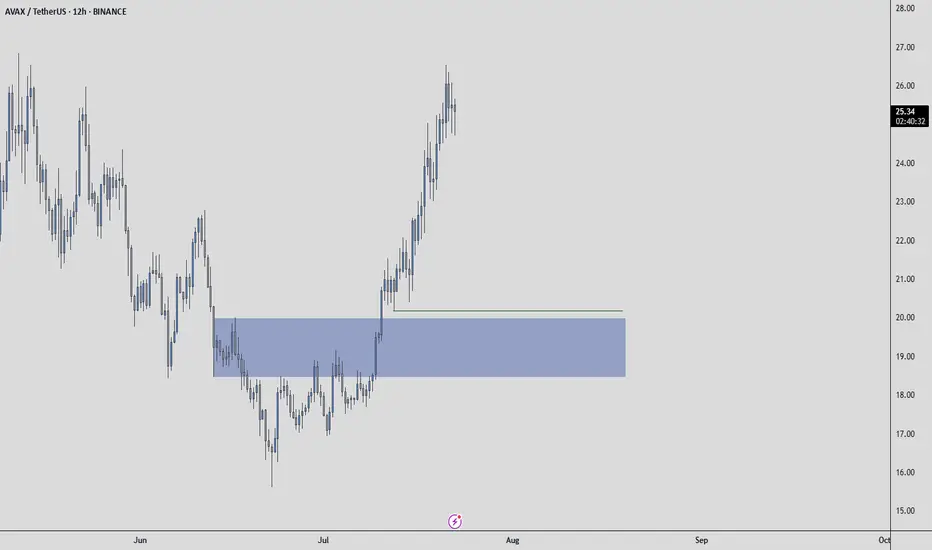
AVAXUSDT: Mid-Term AnalysisThe blue box under liquidity may do the job.
📍 Plan
If price drops into the blue box:
✅ Watch for footprint absorption (buyers stepping in)
✅ Look for CDV support or bullish divergence
✅ Confirm with a structure reclaim before entry
⚡ Reminder
No chasing. No forcing trades.
If the setup aligns, I’ll take it with clear risk.
If not, I’ll wait.
The right price, or no trade.
AVAX/USDT Trade Setup: Bullish Bias with Fibonacci Targets🚀 AVAX/USDT Avalanche is currently in a strong bullish trend 🔼. On the 4H chart, price is pulling back slightly 📉, and I’m watching for momentum to pick up and break above the current range high 📊—that’s where I’ll be looking for the next entry.
🎯 My bias remains long, and in the video I break everything down in detail:
🔍 Price action
🧱 Market structure
📈 Overall trend
📍 Stop loss placement (below the previous swing low)
🎯 Targeting key Fibonacci levels
I also go over my exact Fibonacci settings and how I use them to frame the trade.
This is not financial advice ❌💼

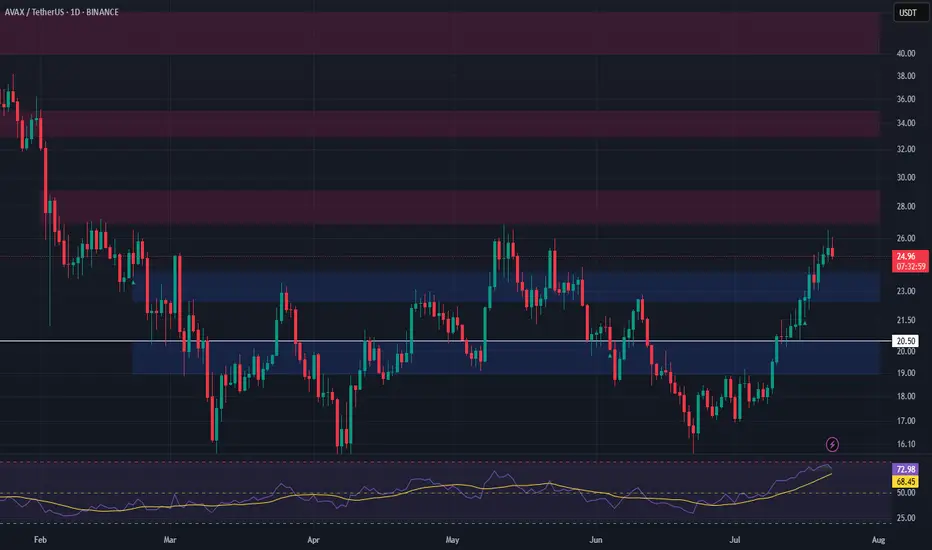
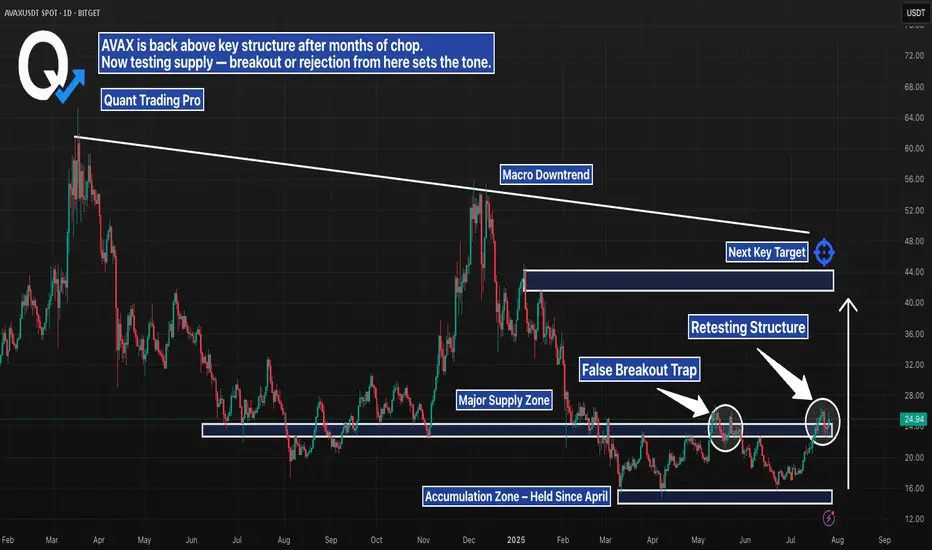
AVAX Daily – Breakout or Another Trap?AVAX just pushed into a major supply zone, testing structure that’s capped price since early 2024. After months of chop and accumulation, bulls have finally reclaimed key support — but the real test is happening now.
Here’s the setup:
– Retesting structure after first rejection
– Sitting below a clear macro downtrend line
– Above an accumulation zone that held for months
– Next key target sits near $40–44, with confluence from prior highs and trendline resistance
This is the kind of move that either builds serious momentum — or turns into another trap. Wait for confirmation. Volume and reaction here will say everything.
#AVAX #Altcoins #CryptoBreakout #SupplyZone #TrendlineResistance #TechnicalAnalysis #QuantTradingPro #PriceAction
AVAXUSDTWe are bear-trend but wait for break trendline and pollback to 18.50$.
BINANCE:AVAXUSDT
Support: 16.90
Resistance: 18.50 - 21.30 - 25.50
⚠️Control money management.

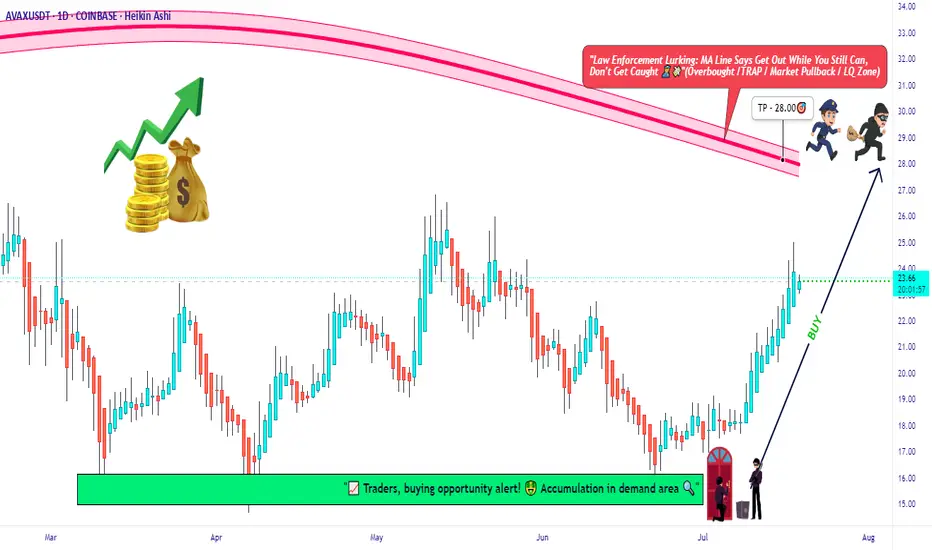
AVAX Long Only | Moving Average Trap Heist in Action🧨“Avalanche Crypto Vault Break-In 💣 | Thief Trader’s Long Playbook”⚔️💸🚀
(AVAX/USDT Crypto Heist Plan – Swing/Day Trade Blueprint)
🌍 Hi! Hola! Ola! Bonjour! Hallo! Marhaba! 🌟
Welcome, Money Makers, Market Pirates, and Chart Snipers! 🤑💰💼✈️
This ain’t just another setup — this is a strategic crypto ambush on AVAX/USDT, cooked up with the 🔥 Thief Trading Playbook 🔥. We're planning a clean, no-fingerprint heist into the Red Moving Average Zone. That’s the liquidity vault, and yes — the police (market makers) are watching 👮♂️🚨... but so are we. Stay sharp. 💼🔦
💥 Mission Objectives:
🎯 Entry Point (The Infiltration Point)
"The vault's wide open! Swipe the Bullish loot at any decent price" 📈
Smart thieves wait for pullbacks on the 15m or 30m chart to plant their limit orders near swing lows/highs. Use layered orders (DCA style) to scale in like a pro. 💣🔁
🛑 Stop Loss (Your Getaway Exit)
Secure your trade. SL at the nearest wick low/high on the 1D timeframe (around 21:00 candle).
Your SL = your personal risk code. Choose it based on lot size & how deep you're inside the vault. 🎭🚫
🏴☠️ Take Profit Target (The Treasure Room)
🎯 Target: 28.00 USDT
...or escape early if the heat (volatility) gets too intense. Protect the bag. 💼💰
⚡ Special Note for Scalpers:
🧲Only operate on the Long Side.
If you’ve got deep pockets, smash in directly. Otherwise, ride with swing bandits. Use trailing SL to secure stolen profits. 🧨📉📈
🔍 Market Heat Map & Rationale:
The AVAX/USDT setup is flashing bullish strength, backed by:
🧠 On-Chain Metrics 📊
💡 Market Sentiment
📰 Macro Catalysts
🌐 Intermarket Synchronicity
📡 Go grab the full breakdown on:
⚠️ Red Alert: News Zones Ahead! 📰🚫
Avoid fresh trades during high-volatility news releases.
Lock in gains with trailing SL. Risk management is not optional — it’s the escape vehicle. 🚗💨
📝 Legal Talk (Don’t Skip):
This isn’t investment advice. Just a well-planned blueprint from a market thief.
You're responsible for your own loot and losses. 🎭📉📈
❤️ Boost the Brotherhood 💥
Smash the 🔥BOOST BUTTON🔥 if you found value.
Every boost powers our Thief Trading Gang’s next big score. 🚀💸
Stay tuned for the next heist plan. I’ll be back with more charts, more loot, and less mercy. 🐱👤📊💥
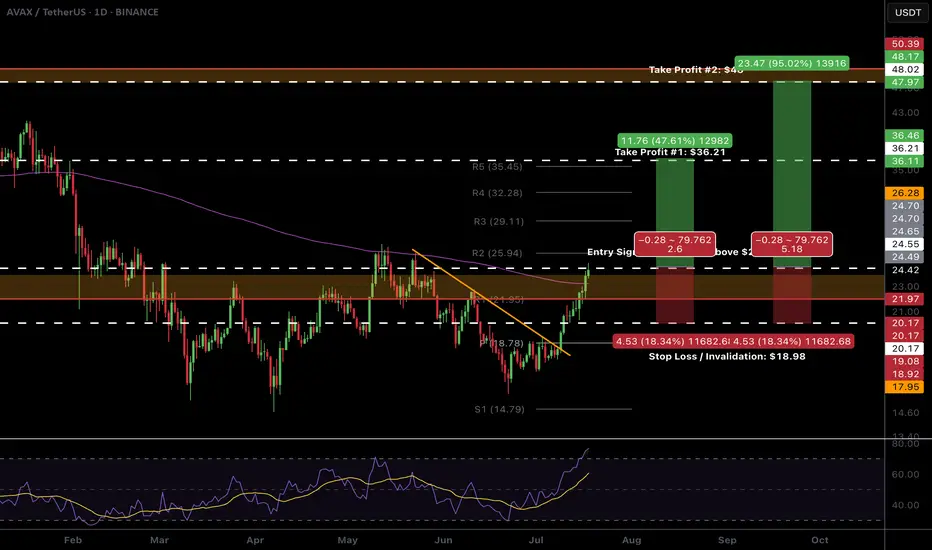
$AVAX Ready to breakout!CRYPTOCAP:AVAX looks ready to pop.
High Volume Node resistance and daily 200EMA is clear and now support. We don't want to see price rejected and moving back below this area.
The R5 daily pivot is my first partial take profit $35-36 followed by the major resistance High Volume Node at $48
Daily RSI is overbought with unconfirmed bearish divergence so watch out for this but should be good to run in the mean time. BTC permitting...
Safe trading