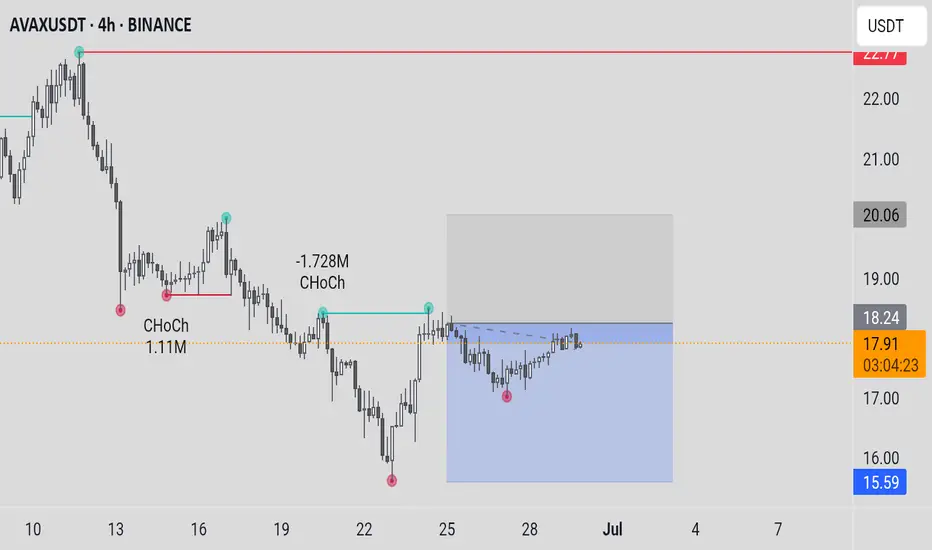
AVAX/USDT - H4 - Wedge Breakout (29.06.2025)The AVAX/USDT pair on the H4 timeframe presents a Potential Buying Opportunity due to a recent Formation of a Wedge Breakout Pattern. This suggests a shift in momentum towards the upside and a higher likelihood of further advances in the coming Days.
Possible Long Trade:
Entry: Consider Entering A Long Position around Trendline Of The Pattern.
Target Levels:
1st Resistance – 21.77
2nd Resistance – 24.35
🎁 Please hit the like button and
🎁 Leave a comment to support for My Post !
Your likes and comments are incredibly motivating and will encourage me to share more analysis with you.
Best Regards, KABHI_TA_TRADING
Thank you.
AVAXUSDT trade ideas

TradeCityPro | AVAX Holds Key Support in Sideways Structure👋 Welcome to TradeCity Pro!
In this analysis, I want to review the AVAX coin for you. It’s another Layer1 and RWA project whose coin has a market cap of 7.48 billion dollars and ranks 16th on CoinMarketCap.
📅 Daily Timeframe
On the 1-day timeframe, as you can see, the price is sitting on a very important and strong support at the 16.46 zone, which I’ve marked as a range for you.
🔍 This range is where buyer makers are heavily present, and the price has touched it three times so far and has been supported each time. This shows the high strength of this zone.
✨ Currently, after being supported from this zone, the price has reached the 18.77 level and is fluctuating below this level. Volume is also gradually decreasing, and we have to see what happens next.
📊 If the volume keeps decreasing like this, the price will probably continue ranging between 16.46 and 18.77 until volume enters the market. But if strong buying or selling volume enters, the price can make a move and exit this range.
✔️ If buying volume enters and the price wants to move upward, we can enter a long position with a break of 18.77 and even buy in spot. A confirmation for this position could be the RSI breaking above the 50 level.
🛒 I personally consider this trigger suitable for a long position, but for spot I suggest waiting for a break of 25.78. More important than that is Bitcoin dominance, and in my opinion, as long as the long-term trend of Bitcoin dominance is bullish, buying altcoins is not logical and we have to wait until dominance changes trend.
📉 If the price wants to move downward and selling volume enters the market, the break of this same support range would be the best trigger. With a break of 16.46, we can enter a short position, and if you already bought this coin in spot, you can activate your stop-loss as well.
💥 A momentum confirmation for this position would be the RSI breaking below the 30 level and the oscillator entering the Oversell zone.
📝 Final Thoughts
This analysis reflects our opinions and is not financial advice.
Share your thoughts in the comments, and don’t forget to share this analysis with your friends! ❤️

Avalanche 2025 All-Time High, Accumulation & Bullish ZonesI am using $495 as the next bullish cycle top. The 2025/26 bull market all-time high. It can be more but it can also be less. We can only guess at this point because the Cryptocurrency market is just so young that everything becomes possible. We err by being conservative.
Avalanche is trading within a long-term accumulation zone. The best possible prices, literally.
The purple-rounded bottoms on the chart denotes an excess.
This year, 2025, the accumulation zone was activated in February. The action then moved within this orange-zone in March and this is where everything is happening now.
If you wanted to put tens of millions of dollars into this project at the best possible prices pre-2025 bull market wave, then you would need to do it based on the long-term. Back in July-August-November 2024 and February, March, April, June and so on 2025.
If you were to buy too big too fast it would push prices up. So whales wait months in order to accumulate. After years of accumulation at low prices, they send the signal and the market can move. Once the market starts moving, the consolidation/accumulation period is over, there is no going back.
The "neutral zone" here is light blue. This is already bullish but not ultra-bullish because there is no continuation inside this zone. Only when Avalanche (AVAX) moves and stays above it we can get a new bull market cycle. Since it only happens every four years, like clockwork, there is no need to guess.
Pre-2021 we buy as much as we can and sell when prices are high up. Post 2021 bearish, SHORT, SHORT, SHORT. After 2022 comes the transition period, the long-term accumulation and consolidation phase. In 2025 is the next bull market, this is where we are at now.
So now we can buy as much as we can but only with the intention to sell when prices are up.
An investor does not sell, only buys forever more. But still, if you are an investor, you shouldn't buy when prices are high. The time is now to accumulate on everything.
A trader sells every few weeks, every few months. Each wave. Buy support (low) and sell resistance (high). Buy low (red) and sell high (green).
You need to know clearly if you are trading or investing. Getting things confused can result in loses. Getting this topic confused simply means lack of planning.
We are entering a major bullish cycle and wave. This is not the time to be a trader if you've never traded before. This is the time to invest, accumulate; buy and hold. Sell only when prices are astronomically high.
When the bullish cycle is over and if you find a pair trading at support, you can buy to sell again within weeks or months. But not now. Now, after you buy, you hold. Makes sense?
We are in this together.
I love you!
Your continued support is appreciated, truly.
Namaste.

AVAX Possible scenarioAVAX is currently in a downtrend and has approached a key support zone. Price action has formed a bearish flag pattern, suggesting a continuation of the prevailing trend. The market is currently in a correction phase within this flag.
If the support fails and the pattern breaks to the downside, AVAX may slide toward the next bearish target around $14.
However, if the resistance of the flag is broken to the upside, it would invalidate the bearish setup and could shift momentum toward a recovery, with a potential move toward $22.5 as the first bullish target.
Let’s monitor how the price reacts near the edges of this pattern to assess whether continuation or reversal plays out.

Avalanche AVAX price analysis🔴 Do you think that the price of CRYPTOCAP:AVAX has bottomed out and is completing a "double bottom" pattern?
📉 Will there be another downward movement in the price of OKX:AVAXUSDT , for example to $14, followed by the long-awaited upward trend?
Either way, in both cases, there is every chance that the price of the #Avalanche token could reach $45 by the end of 2025.
P.S:
The price of #AvaxUSD is moving nicely along the established channels — take advantage of this and make a profit!
_____________________
Did you like our analysis? Leave a comment, like, and follow to get more

HolderStat┆AVAXUSD seeks to retest $17BINANCE:AVAXUSDT is pushing upward after a breakout from the falling channel structure, reclaiming the $17 support area. The short-term projection points toward $19, with upside potential toward $22 if the channel resistance breaks. Momentum is building from the breakout zone.

AVAX (Avalanche) Breakout? Here’s My Trade Plan.📊 Market Breakdown: AVAX/USDT (Avalanche)
Currently monitoring AVAX/USDT, and both the daily and 4-hour timeframes are showing a clear bullish break in market structure — a key signal that the momentum may be shifting to the upside.
That said, I’m not jumping in just yet. I’m only looking for long opportunities if specific criteria are met:
✅ A clean break above a key resistance level
✅ A retest of that level, followed by a failed attempt to move lower
If these conditions are confirmed, I’ll be watching for a high-probability entry from that zone.
🎥 In the video, I also walk through how to use several powerful TradingView indicators, including:
Volume Profile
VWAP
These tools help sharpen the edge and support decision-making in live market conditions. If the setup doesn’t materialize as expected, we simply stand aside — discipline is key.
📌 Disclaimer: This is not financial advice, just a breakdown of how I approach this potential opportunity.

AVAXUSDT
Avalanche (AVAX) is currently trading in the $17–$19 range, showing some short-term consolidation after a gradual decline .

AVAXUSDTAvalanche (AVAX) is currently trading in the $17–$19 range, showing some short-term consolidation after a gradual decline .

Avalanche (AVAX): Signs of Upcoming Bullish MovementWe noticed a similar pattern, where each time after liquidity hunting near a local support area, we were entering into the next buyside movement, which might indicate that we are about to enter another one pretty soon.
We are looking for upward movement from this region, which would lead the RSI into overbought zones, giving us from there then an opportunity to short, but meanwhile we are longing!
Swallow Academy

AVAXUSDTWe are bear-trend but wait for break trendline and pollback to 18.50$.
BINANCE:AVAXUSDT
Support: 16.90
Resistance: 18.50 - 21.30 - 25.50
⚠️Control money management.

AVAX | Trade setup📌 After the reaction from the bearish target zones (blue), we've now activated a bullish sequence (yellow) in $Avax.
📊 Valid entries are currently forming during a potential B-C correction.
Trademanagement:
I'm placing long orders at each level.
Once the trade reaches a 2 R/R, I’ll move the stop-loss to break-even.
From a 3 R/R onward, I’ll start locking in profits.
Once I’ve locked in my first profits, I’ll share the next profit targets with you.

AVAX/USDT Weekly Reversal Zone — Major Support Holding
🟨 CRITICAL ZONE (Key Support Area)
AVAX is currently trading within a major demand zone between $13.5–17.5, a historically strong support area that previously acted as the base for significant upward movements. Multiple weekly candles show rejection from this level, indicating buyer interest.
📊 Pattern Overview:
Double Bottom / Potential Triple Bottom:
The chart illustrates a clear double bottom structure, potentially forming a triple bottom, suggesting accumulation and reversal from the lows.
Bullish Projection Path:
The yellow arrow outlines a projected bullish impulse wave, targeting higher resistance levels if support holds.
📈 Bullish Scenario:
If AVAX maintains support at around $17.1:
1. Price may first test $20.25 (initial resistance).
2. A breakout above $20.25 could open the way to:
$24.98 (strong weekly resistance)
$32.75 (previous distribution zone)
$55.42 (major target/resistance zone)
3. In an extended bullish cycle, price could revisit:
$98.87, $110, and even $128.62 long term (2026+)
A confirmed breakout above $25 with strong volume would further validate the bullish case.
📉 Bearish Scenario:
If the $15–17 support zone breaks down:
1. Price could drop further to:
$11.00 (minor support)
$8.61 (historical low and weekly support)
2. This would indicate strong bearish pressure, potentially leading AVAX into a longer-term accumulation phase.
🔍 Conclusion:
This is a critical decision zone for AVAX. The technical structure shows signs of accumulation and possible trend reversal. However, if support fails, a deeper retracement could occur. Traders should watch this area closely for breakout or breakdown confirmations.
#AVAX #AVAXUSDT #Avalanche #CryptoReversal #TechnicalAnalysis #Altcoins #WeeklyChart #CryptoSupportZone #CryptoBreakout

AVAX/USDT – Bullish Channel Setup with Strong Risk/RewardAVAX is currently respecting a clear bullish channel on the 1H timeframe. Price just tapped the lower trendline and key Support Zone #1, forming a potential higher low setup.
If this trendline holds, I’m expecting a bounce targeting the 19.50–20.00 resistance zone — aligning with the top of the channel.
📌 Entry Zone: Around 17.50
🎯 Target: 19.50–20.00
🛑 Stop: Below 16.90
This setup offers a clean risk-to-reward and follows the broader channel structure. Watching for a confirmation bounce or bullish engulfing candle off support before entering.
💬 Let me know what you think — bullish continuation or deeper pullback incoming?
#AVAX #CryptoTrading #PriceAction #BullishChannel #TradingView #TA #Altcoins

Avalanche (AVAX): Price In Bullish Trend | Might Pump SoonAvalanche had another bounce from the bullish trend where we are getting more and more confirmation of the possible bounce that we might be seeing from here. There is not much to say but as long as we stay inside that bullish trend, we are good for long.
Swallow Academy

HolderStat┆AVAXUSD broke the resistanceBYBIT:AVAXUSDT on the 3h chart has confirmed a breakout from a falling wedge and is retesting $17.26. Price is now forming a higher low, with targets set at $20.50 and $23. This breakout structure supports continuation as momentum shifts back to buyers.

AVAX Analysis (1D)From the point where we placed the red arrow on the chart, it seems a correction has begun.
This correction appears to be a Diametric pattern, and wave E does not seem to be complete yet. It's expected that wave E will finish within the green zone.
The target could be the red box area.
A daily candle closing below the invalidation level would invalidate this analysis.
invalidation level: 10.90$
For risk management, please don't forget stop loss and capital management
When we reach the first target, save some profit and then change the stop to entry
Comment if you have any questions
Thank You

#AVAX/USDT#AVAX
The price is moving within a descending channel on the 1-hour frame and is expected to break and continue upward.
We have a trend to stabilize above the 100 moving average once again.
We have a downtrend on the RSI indicator that supports the upward move with a breakout.
We have a support area at the lower limit of the channel at 17.22, acting as strong support from which the price can rebound.
Entry price: 17.54
First target: 17.92
Second target: 18.22
Third target: 18.62

Lingrid | AVAXUSDT strong REBOUND from the SUPPORT zoneCRYPTOCAP:AVAX is rebounding from the lower boundary of its descending channel after a deep sweep into the buying area near 17.00. The price formed a local bottom and is attempting to reclaim the 17.45–18.50 resistance band, hinting at early bullish intent. If buyers sustain this recovery, a test of the 20.00 psychological barrier could follow.
📈 Key Levels
Buy zone: 16.20–17.00
Sell trigger: breakdown below 15.80
Target: 20.00
Buy trigger: breakout and retest of 18.50 resistance
💡 Risks
Failure to break 18.50 may trap longs below key resistance
Breakdown from support invalidates current bullish setup
Broader downtrend still dominant unless 20.00 is reclaimed
If this idea resonates with you or you have your own opinion, traders, hit the comments. I’m excited to read your thoughts!

avaxusdtavaxusdt looks like making a 12 set up .invalidation level for long is 14.65 . correction seems complete .never trade without a stoploss

Avalanche (AVAX): Seeing Bullish Trend | Possible 30% MovementAvalanche has formed the bullish channel here, where we are at the lower side of that channel, which might be the bounce zone for us. We are keeping a close eye on this zone and as soon as we see some signs of recovery near this region, we will be looking for bullish movement, which could give us a good 30% movement.
Swallow Academy

AVAXUSDTCryptocurrency Futures Market Disclaimer 🚨🚨🚨
Trading cryptocurrency futures involves high risks and is not suitable for all investors.
Cryptocurrency prices are highly volatile, which can lead to significant gains or losses in a short period.
Before engaging in crypto futures trading, consider your risk tolerance, experience, and financial situation.
Risk of Loss: You may lose more than your initial capital due to the leveraged nature of futures. You are fully responsible for any losses incurred.
Market Volatility: Crypto prices can fluctuate significantly due to factors such as market sentiment, regulations, or unforeseen events.
Leverage Risk: The use of leverage can amplify profits but also increases the risk of total loss.
Regulatory Uncertainty: Regulations related to cryptocurrencies vary by jurisdiction and may change, affecting the value or legality of trading.
Technical Risks: Platform disruptions, hacking, or technical issues may result in losses.
This information is not financial, investment, or trading advice. Consult a professional financial advisor before making decisions. We are not liable for any losses or damages arising from cryptocurrency futures trading.
Note: Ensure compliance with local regulations regarding cryptocurrency trading in your region.
thanks for like and follow @ydnldn
AVAXUSDT Short from Tight Range RejectionAVAXUSDT is showing signs of exhaustion near the resistance zone around 17.57, where price repeatedly failed to break higher. The market structure is consolidating with multiple wicks into the resistance zone, suggesting supply is stronger than demand at that level.
The current short setup is placed just below that resistance area, aiming for a breakdown from the consolidation. The stop loss is set above the most recent spike at 17.69, while the take profit is targeting near the trendline support at 17.21.
This setup banks on a reversal from the top of the range and offers a solid risk-to-reward.
🧩 Trade Parameters:
- Entry: 17.57
- Stop Loss: 17.69
- Take Profit: 17.21
🔢 Risk:Reward Calculation:
- Risk: 17.69 − 17.57 = 0.12
- Reward: 17.57 − 17.21 = 0.36
- Risk:Reward Ratio: 1 : 3.0 ✅ (Strong)
✅ Bias:
Short-term bearish; ranging top with lower highs
🔄 Confirmation Needed:
- Bearish engulfing or strong rejection candle
- Break below short-term support
- Weak volume on upside attempts
❌ Invalidation:
A clean breakout and hold above 17.69
