Will AVAX (Avalanche) reach $100?Avalanche (AVAX) has been steadily growing across various sectors for quite some time.
We are also witnessing the silent rise of Avalanche's DeFi ecosystem, which continues to expand quietly yet steadily.
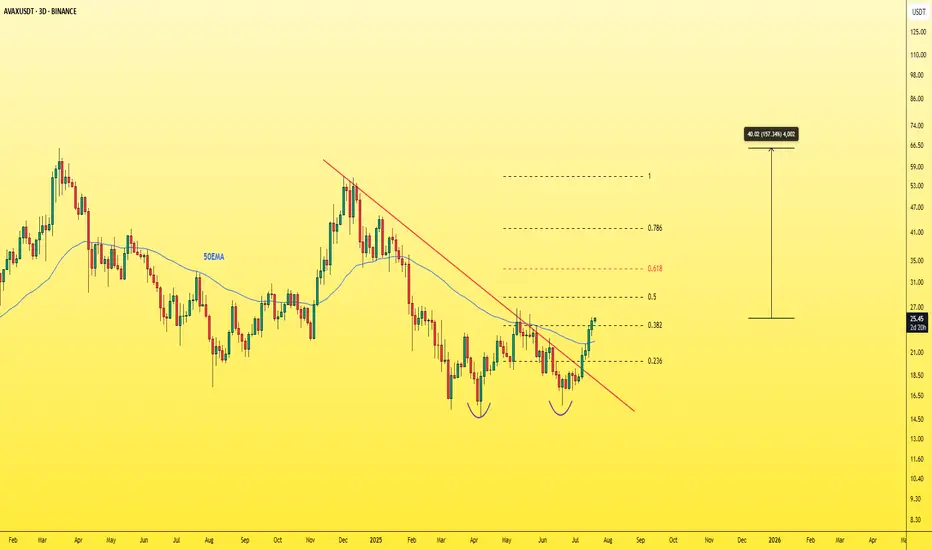
If the daily candle closes above this resistance level, we could start moving toward higher targets.
Don’t forget that breaking the long-term trendline is a crucial event — and with Bitcoin dominance on the decline, it might finally be AVAX’s time to shine.
Let’s also not forget that AVAX ETFs are on the way.
AVAXUSDT trade ideas

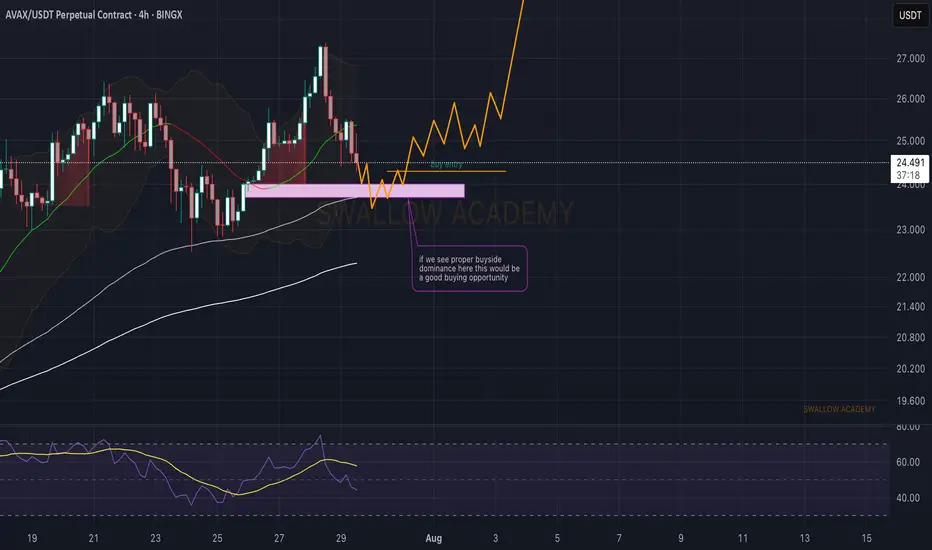
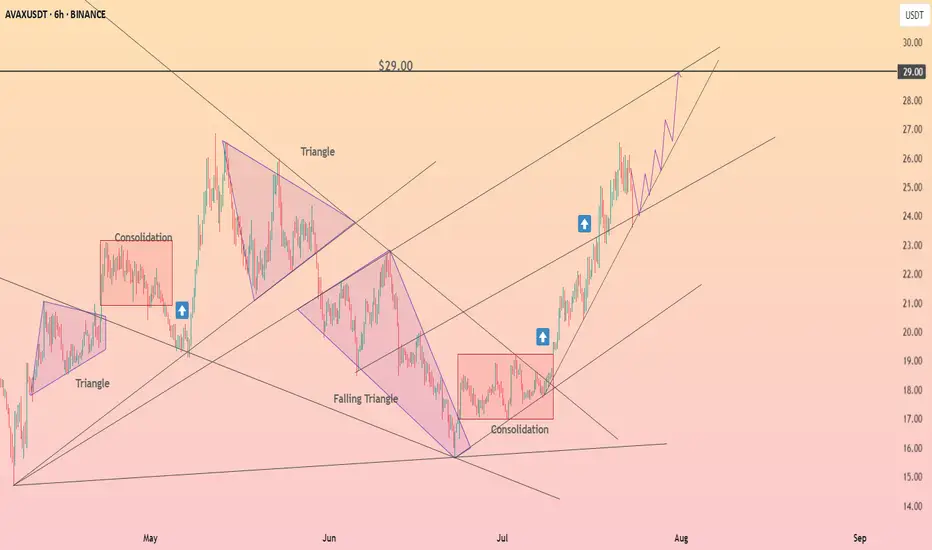
Lingrid | AVAXUSDT Corrective Move In The MarketThe price perfectly fulfilled my previous idea . BINANCE:AVAXUSDT retraced sharply from the 27.34 resistance zone after making a higher high but found support above the descending trendline. The recent corrective move has paused at a key structure level near 24.96, hinting at potential bullish continuation. A breakout above this local resistance could trigger a rally toward the 26.50–27.34 target zone. Momentum builds as long as price remains above the trendline and higher low structure.
📈 Key Levels
Buy zone: 24.80 – 25.30
Buy trigger: Break and hold above 25.30
Target: 26.50
Invalidation: Close below 24.00
💡 Risks
Downward trendline still active and could act as resistance
Potential for bearish fakeout before breakout
Failure to reclaim 25.30 quickly weakens bullish scenario
If this idea resonates with you or you have your own opinion, traders, hit the comments. I’m excited to read your thoughts!

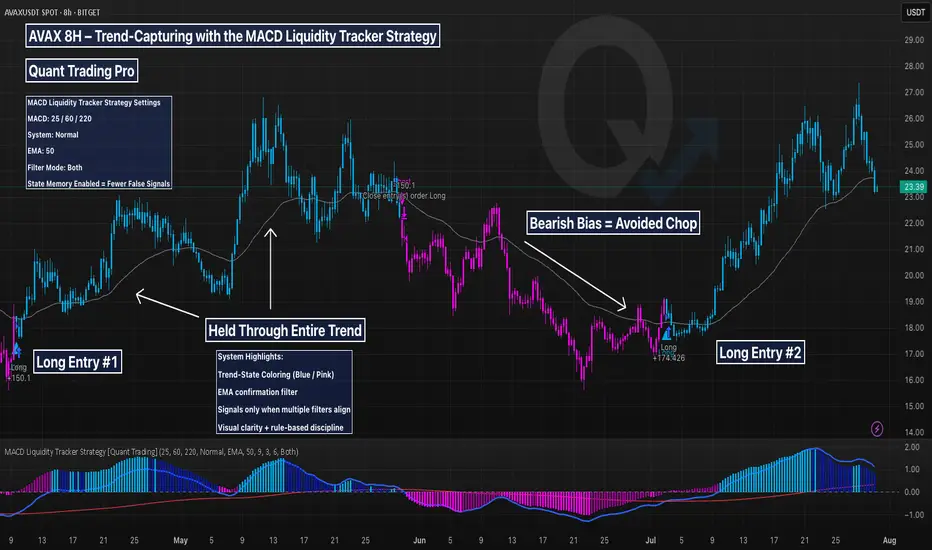
AVAX 8H – Trend-Capturing with the MACD Liquidity Tracker This AVAX 8H chart is a prime example of how the MACD Liquidity Tracker Strategy captures major trends with minimal noise. Designed for swing traders and trend followers, this system uses MACD momentum (25/60/220) and a 50-period EMA to filter entries and avoid chop.
🔍 What This Chart Shows:
A +150% long triggered in April and held cleanly through the rally
No entries during the June downtrend — thanks to bearish state filtering
A fresh +174% long in July as momentum and trend realigned
Visuals are crystal clear:
Blue candles = Bullish bias
Pink candles = Bearish bias
Arrows = Filtered entries only
MACD Histogram = Momentum strength
EMA = Trend direction
🧠 Why It Works:
Most traders struggle with second-guessing and emotional exits. This system removes the guesswork by enforcing strict momentum + trend alignment and delaying signals during unclear price action.
Ideal for crypto traders who want to follow strong trends with confidence and skip the noise in between.
Avalanche (AVAX): Looking For Buy Entry | Potential Fill of CMEAvalanche is still hovering above the 100EMA, which means we are still looking for buy-side entries on the coin.
What we see is the bearish CME gap, which we intend to see filled and where also our buy entry will be sitting, so eyes on that zone for now.
Swallow Academy
Avalanche · Early or Late? · Targets & TALook at AVAX. It traded at $18 for 21 days, three weeks, and now its price is already at $27, 50% higher. That's how it all changes in a matter of days. In just 19 days Avalanche is trading much higher and soon you won't be able to get a buy below $50. $18 will seen like an old dream. Gone so long ago but it was available just recently. The same will happen with the current price.
Avalanche is still cheap below $30. The all-time high is $147. We can easily aim for $100 just to see how things will go. We know this level can hit easily so buying below $30 should be an easy decision and choice. That is if you like this pair.
This is another strong project, another bullish chart but always focused on the long-term. If you are looking at it very close, we can have days red but nothing changes. This will not change the bigger path that is being travelled to a new all-time high. So only leveraged traders should be careful when opening a new LONG position because the market can shake the next day. If you trade spot, buy and hold; buy and accumulate with no worries necessary because it is still early.
You can do great in this bull market; we can all do great. More opportunities will continue to develop and the market will continue to heat up.
The next major target for this project mid-term is $64, followed by $96 and then the ATH.
Once we enter the price discovery phase, new all-time high territory, anything goes. The action can continue rising and hit levels hard to imagine, for months, or it can stop just after a few weeks. It all depends on how much money into the market flows.
Namaste.

Avalanche (AVAX): Waiting For Proper Breakout | 3 Step BreakAvalanche is slowly gaining some kind of bullish volume, where we are expecting to see smaller upward movement.
On bigger timeframes we are sitting just at the major neckline area so this is why we also considered the current zone to be a good bounce area, so let's wait for a proper breakout now.
Swallow Academy

AVAXUSDT - THE real treasure must be hunted!Let's not forget about CRYPTOCAP:AVAX — it's one of the must-have assets in any crypto portfolio.
Currently trading at a discounted price after dropping from its previous top at $55, AVAX now shows strong bullish potential with plenty of upside ahead.
🚀 Key bullish signs:
-Successfully broke through multiple resistance levels, including the 0.382 Fibonacci retracement, 50 EMA, and the main descending trendline.
-A daily close above the 26$ level is a very positive signal.
With a solid project, reliable fundamentals, and low risk compared to potential reward, this could be a highly profitable opportunity.
Don’t sleep on it.🎯
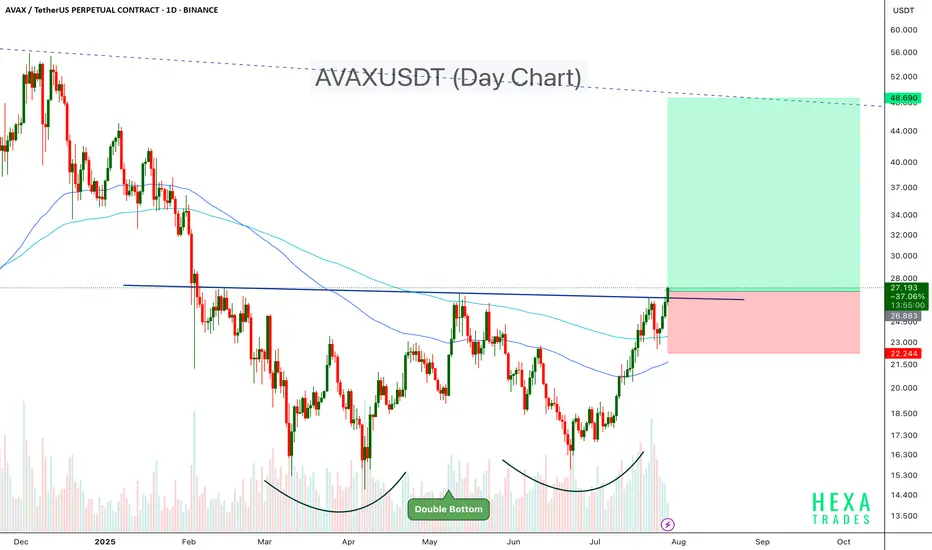
AVAXUSDT Double Bottom Confirmation.AVAX has formed a textbook double bottom pattern on the daily chart, signaling a potential reversal after months of downtrend. The neckline around the $27 zone has been broken decisively, confirming the bullish breakout.
Key Points:
- Double Bottom Structure: A strong bullish reversal pattern with a clean neckline breakout.
- Breakout Level: $27, which was acting as resistance for the past several weeks.
- Volume Surge: Noticeable increase in volume during the breakout, adding strength to the move.
- Target: $48–$50 region. ( Channel resistance)
-Stop-Loss Idea: Below $22.0
AVAX appears ready to trend higher as momentum builds. If bulls hold above the breakout zone, the rally may accelerate in the coming weeks.
Cheers
Hexa
AVAX – Hidden Chance for Latecomers🔥AVAX – High-Potential Setup Amid Market Catch-Up
While many crypto assets have surged in the recent bullish wave, AVAX appears to have been left behind — and that could present a high-reward opportunity ahead.
From both a fundamental and on-chain perspective, this project shows promising signs, especially with notable activity among whale wallets. I believe AVAX has the potential for a strong long-term rally — but there’s one critical condition to watch.
Price has recently reacted to a key custom demand zone. However, for confirmation of buy-side strength, we need to see a clean breakout and daily close above the ~$28 level. If that breakout is confirmed, I’ll be looking to accumulate for a long-term hold, with a target of $65 — and possibly up to $100 if momentum continues.
That said, risk management remains my top priority. I’ll allocate no more than 3–4% of my total portfolio to this position.
Keep an eye on the $28 breakout. If the trade is triggered, I’ll provide updates here.
🔁 This analysis will be updated whenever necessary.
Disclaimer: This is not financial advice. Just my personal opinion.
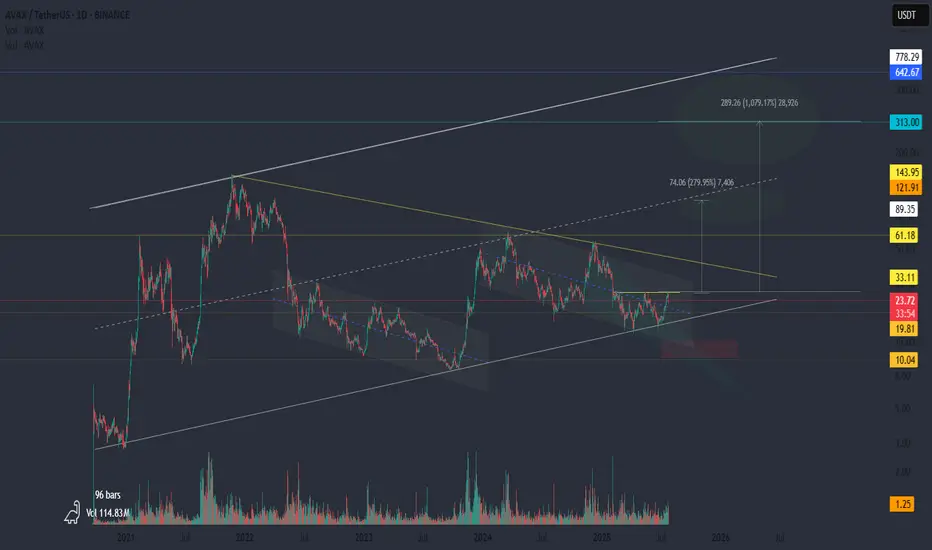
AVAX: A Quiet Rocket?This might be the calm before the cycle.
📍 All the liquidity is above.
Levels like 33 and 61 aren’t just resistance — they’re fuel. Clusters of short liquidations and forgotten limit orders are sitting right there. If we get a breakout, it could be sharp. And if there’s another pullback? Don’t panic. That would be the test — the shakeout before the move.
🚀 If the cycle kicks in, AVAX could be one of the silent leaders.
While the crowd is focused elsewhere, AVAX has been building quietly: structure, accumulation, time. The kind of setup that doesn’t scream hype, but whispers opportunity.
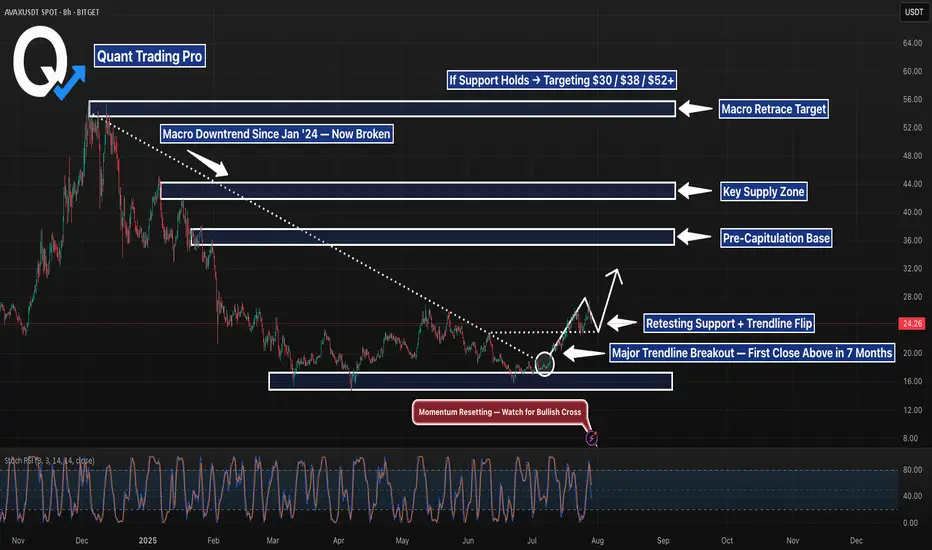
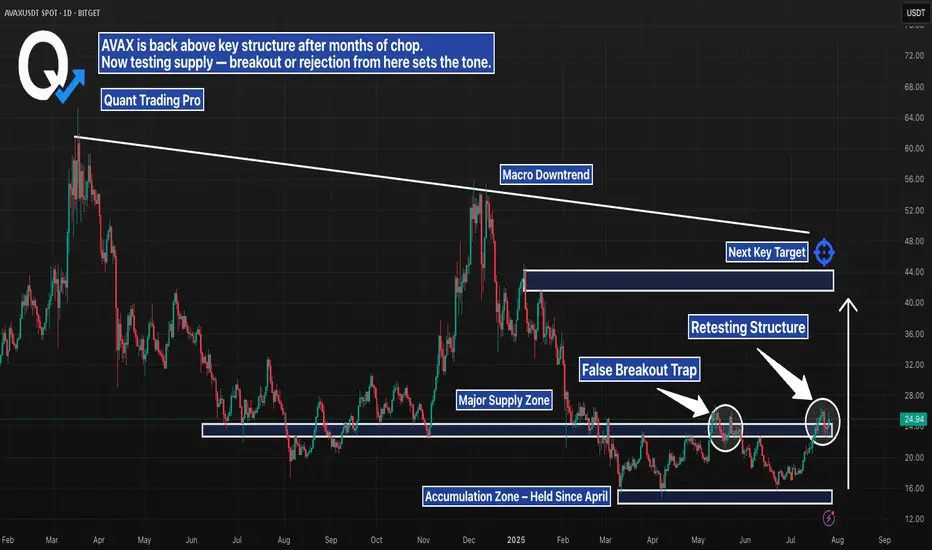
AVAX Daily – Breakout or Another Trap?AVAX just pushed into a major supply zone, testing structure that’s capped price since early 2024. After months of chop and accumulation, bulls have finally reclaimed key support — but the real test is happening now.
Here’s the setup:
– Retesting structure after first rejection
– Sitting below a clear macro downtrend line
– Above an accumulation zone that held for months
– Next key target sits near $40–44, with confluence from prior highs and trendline resistance
This is the kind of move that either builds serious momentum — or turns into another trap. Wait for confirmation. Volume and reaction here will say everything.
#AVAX #Altcoins #CryptoBreakout #SupplyZone #TrendlineResistance #TechnicalAnalysis #QuantTradingPro #PriceAction
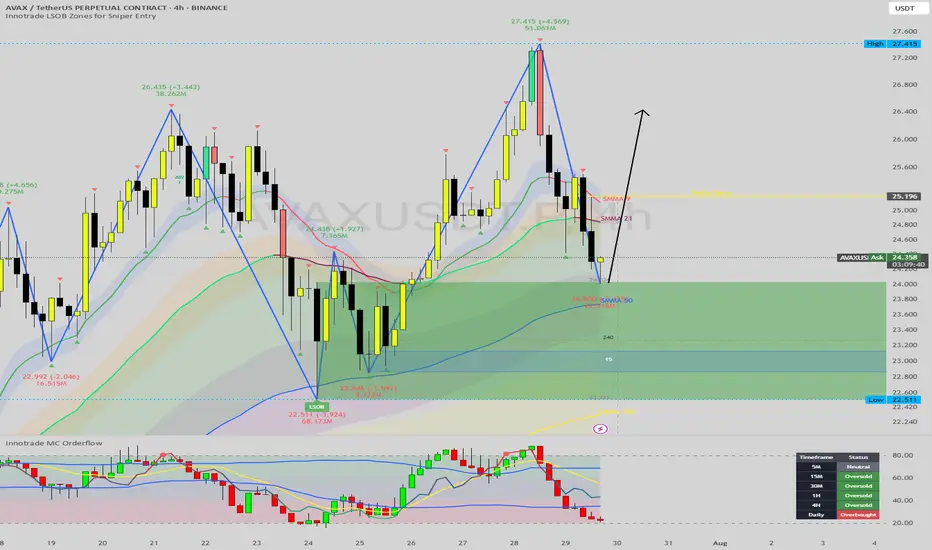
AVAX at the Golden Pocket: A High-Confluence Long Setup EmergesHello, traders. Today, we're analyzing Avalanche (AVAX), which has undergone a healthy and necessary correction after a powerful impulsive move upwards. Price has now pulled back to a critical decision point that is loaded with a confluence of technical support signals.
This analysis will break down, step-by-step, why the current price zone represents a high-probability area for a bullish reversal, potentially kicking off the next major leg up. This is an educational walkthrough demonstrating how to stack technical factors to build a strong trade thesis.
The Analysis: Stacking the Technical Confluences
A high-probability trade is rarely based on a single signal. It's built on multiple, independent factors all pointing in the same direction. Here is the confluence we are seeing on the AVAX 4H chart:
1. The Bullish Market Structure:
First, the context. The overarching trend for AVAX is clearly bullish. Our Zig-Zag indicator confirms a strong pattern of higher highs and higher lows. The current dip is, therefore, considered a corrective pullback within a larger uptrend, meaning we should be looking for buying opportunities, not fighting the trend.
2. The Golden Pocket (Fibonacci Retracement):
We've drawn a Fibonacci retracement from the beginning of the last impulsive leg up (
22.54)
Price has now pulled back precisely into the "golden pocket" between the 61.8% and 78.6% levels. This zone is a classic, high-probability area for trend continuation entries, as it often represents a point of equilibrium before the dominant trend resumes.
3. The Bullish LSOB (Liquidity Sweep Order Block):
The most significant signal in this area is the large green LSOB zone. This institutional footprint was formed after a sweep of a prior low and represents a major area of buying interest. The fact that the golden pocket lies directly within this LSOB provides a powerful layer of confirmation. Price has now entered this zone, effectively mitigating the imbalance and reaching a key area of demand.
4. Dynamic & Static Support Confluence:
Octo MA: The EMA 100 is flowing directly through the LSOB, providing a strong layer of dynamic support.
Daily Open: The Daily Open is situated just above, acting as an initial magnet and a potential first target for a bounce from this zone.
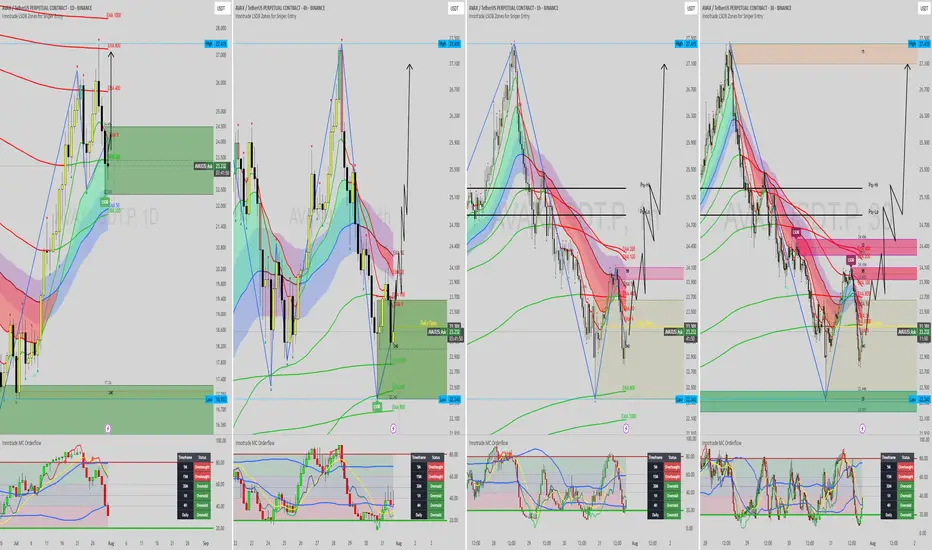
5. Momentum Exhaustion (Oscillator Analysis):
This is the final, critical piece of the puzzle. Our MC Orderflow oscillator in the sub-chart shows that selling momentum is deeply exhausted, with the lines pushing into the green oversold territory.
Critically, the Dashboard confirms this across multiple timeframes (5M, 15M, 30M, 1H, and 4H are all flashing "Oversold"). This is a powerful signal that sellers are losing control and the market is primed for a reversal, providing excellent timing for a potential entry.
The Potential Trade Plan
Based on this strong confluence, here is a potential trade plan:
Entry Zone: The current area between $23.50 and $24.80 (the LSOB / Golden Pocket) is the ideal entry zone.
Stop Loss: A logical stop loss can be placed just below the low of the LSOB and the 100% Fibonacci level, around $22.40. This invalidates the entire setup if hit.
Potential Targets:
Target 1: The Daily Open / 38.2% Fib level at ~$25.40.
Target 2: A retest of the recent swing high at $27.41.
Target 3 (Extension): If the trend resumes with strength, longer-term targets can be found at the 127.2% or 161.8% Fibonacci extension levels.
Conclusion
We have a powerful alignment of bullish market structure, a golden pocket retracement, a major institutional LSOB zone, dynamic MA support, and clear momentum exhaustion. This stack of confluences presents a compelling case for a long position on AVAX.
Disclaimer:
This content is for educational purposes only and does not constitute financial or investment advice. Trading carries a high level of risk. Please do your own research and consult with a professional financial advisor before making any investment decisions. You are solely responsible for any trades you take.
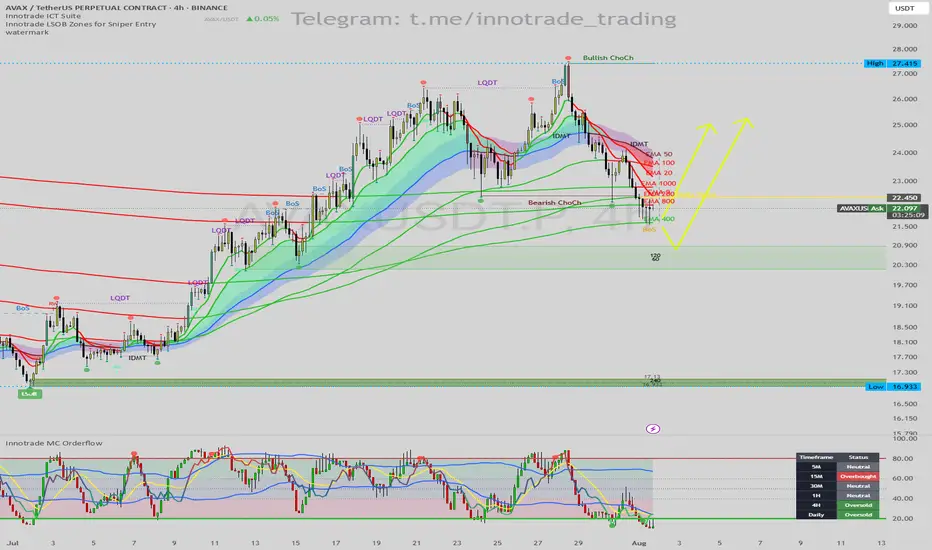
AVAX/USDT: Bullish Reversal at MA Support & Daily OversoldHello traders,
Today's analysis focuses on a high-probability long setup for AVAX/USDT on the 4H timeframe. The price has pulled back to a critical area where a confluence of powerful technical indicators suggests a significant bounce or reversal is imminent.
1. Trend & Context (The "Why")
Following a strong uptrend, AVAX entered a corrective phase, marked by a Bearish Change of Character (ChoCh). This correction has now brought the price to an A+ support zone.
Here are the key confluences for this bullish setup:
Major Support Cluster: The price is currently reacting to a critical support cluster formed by the EMA 200 and EMA 400. These long-term moving averages are major levels where institutions often step in to buy.
Momentum Exhaustion (MC Orderflow): The Innotrade MC Orderflow oscillator provides the critical confirmation that selling pressure is exhausted:
The oscillator is deep in the OVERSOLD territory on the 4H chart.
THE CRITICAL MTF CONFLUENCE: The Multi-Timeframe Cycle Table is the most important factor here. It shows that both the 4H and Daily timeframes are "Oversold". This alignment of higher timeframe momentum at a key technical support level is a very powerful signal for a reversal.
2. Entry, Stop Loss, and Targets (The "How")
The alignment of these factors gives us a clear and actionable trade plan with a great risk-to-reward profile.
Entry: An entry around the current price ($21.50 - $22.10) is ideal, as we are right at the MA support cluster.
Stop Loss (SL): $21.20. This places the stop loss safely below the EMA 400 and the recent swing low, providing a clear invalidation point for the setup.
Take Profit (TP) Targets:
TP1: $24.00 (Targeting the Bearish ChoCh level and the cluster of short-term EMAs).
TP2: $26.50 (The next major swing high, a logical area of resistance).
TP3: $27.40 (The major high of the entire range, a longer-term target if the uptrend resumes).
Conclusion
This trade setup is of very high quality due to the powerful confluence of a major MA support cluster with a confirmed multi-timeframe momentum exhaustion signal (4H and Daily). This synergy creates a high-probability environment for a significant bullish reversal.
Disclaimer: This is not financial advice. This analysis is for educational purposes only. Always conduct your own research and manage your risk appropriately.
AVAX Massive Move Coming!Price is at a strong bottom — one of the best buying zones. Just need a break above $27 to confirm the move.
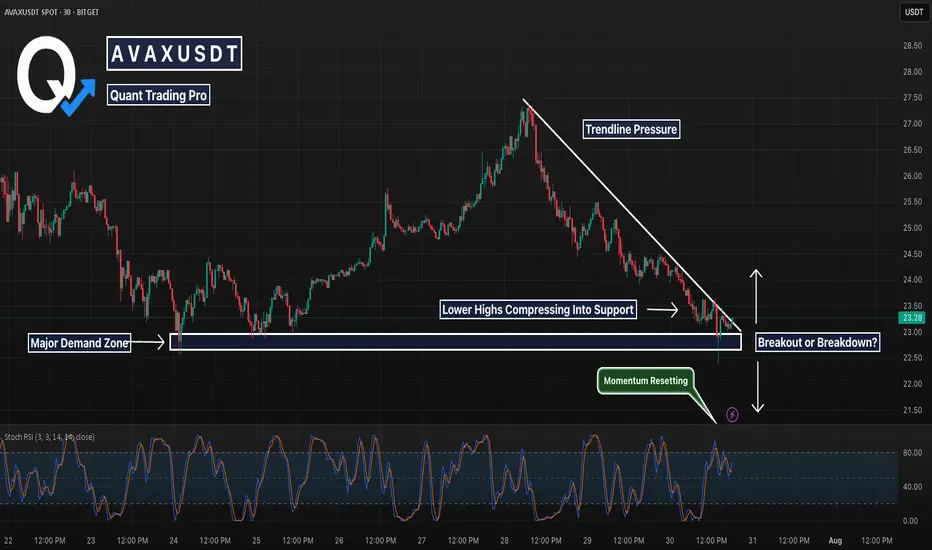
AVAX 30m – Compression Into Support, Breakout or Breakdown Next?AVAX has been grinding down inside a descending triangle, pressing into a major support zone that’s already seen multiple reactions.
📉 Price action is currently wedged between:
Strong horizontal demand (white box)
Well-defined trendline resistance (descending white line)
Today’s wick below support was aggressively bought up — but until we get a clean break from this squeeze, momentum remains neutral at best.
🔍 What We’re Watching:
Support holding = possible spring and breakout setup
Rejection from trendline = bearish continuation structure
Stoch RSI reset = momentum is primed for a move in either direction
This is a textbook example of compression → expansion. Break + retest setups will be key
Avalanche corrected from resistance ┆ HolderStatBINANCE:AVAXUSDT broke below $27.6 and is testing $25.9. Breakdown may open $24.5. Bears remain in control.
AVAX Update - Second Chance for a Long positionAVAX left Bullish-FVG behind. It's normal that price comes back to take it's FVG. Long setup is in tact.
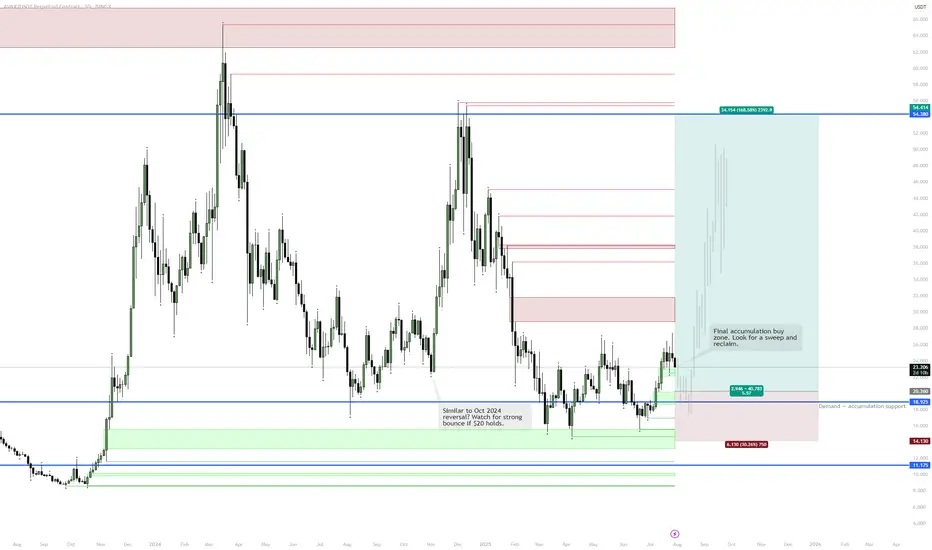
AVAX | Final Accumulation & Potential ReversalContext:
Price is in a major accumulation range, showing similarities to the October 2024 setup.
Green zones indicate strong demand/support; blue is key structural support.
Step-by-Step Scenario:
Accumulation Phase:
Price is consolidating above the $20 level, with repeated defenses of the support zone.
Spot Buys:
Orders set in the $19–$20 area to capture a potential “final shakeout.”
Spring/Reversal:
If price sweeps below $20 and quickly reclaims the level, this signals the final flush before reversal — mirroring the October 2024 bottom structure.
Upside Target:
First major resistance at $38, but the big objective is the $54–55 range, marking previous macro highs and supply.
Invalidation:
A sustained close below $14.1 would break the accumulation structure and invalidate the bullish scenario.
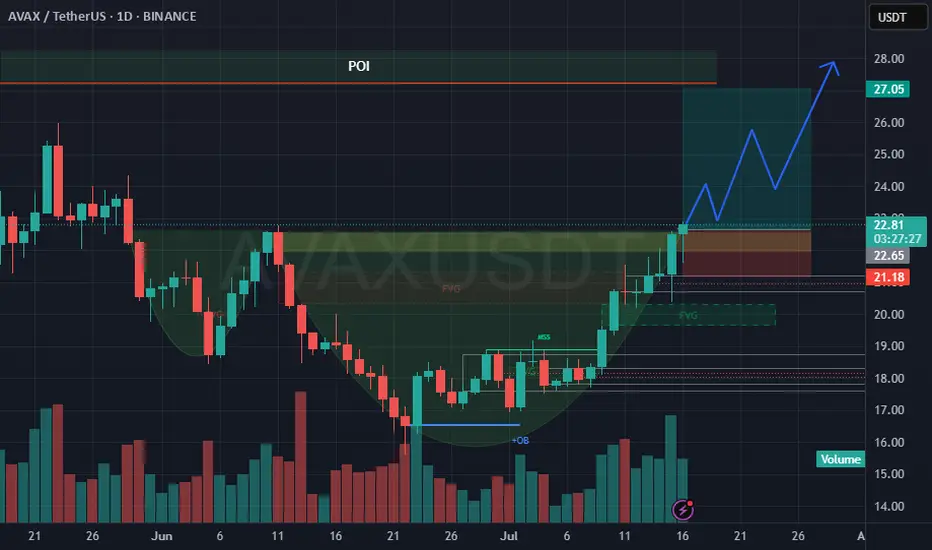
LONG ON $AVAXThe AVAX/USDT chart presents a bullish continuation setup supported by a completed cup formation, bullish market structure shift (MSS) and fair value gap (FVG) fills. With rising volume on the right side of the cup and a clean break above recent resistance, the market shows clear signs of institutional interest and buyer strength. The price is approaching a Point of Interest (POI) near $27, which is likely to serve as a target zone or temporary supply barrier.
A long trade setup is valid between $21.50 and $22.60 which aligns with the retest of the FVG zone, previous structure breakout and early handle development. Stop loss should be placed at $20.9, protecting the setup from invalidation while maintaining a strong risk-reward profile. Target levels include $24.50 (TP1) for an early exit, $26.80 (TP2) near the POI base and $27.05\$27.20 (TP3) at the top of the expected move. R:R range from 2:1 up to 5:1 depending on point of entry.
To execute, traders should watch for bullish confirmation on lower timeframes (1H–4H) within the entry zone, such as a bullish engulfing candle, BOS or a volume-backed rejection. A scaling entry strategy can improve average price and partial profit-taking at key levels ensures the position remains protected as the trade unfolds. Overall, the structure, volume, and Smart Money signals support a high-probability long from the $21.50\$22.60 range toward the $27 POI.
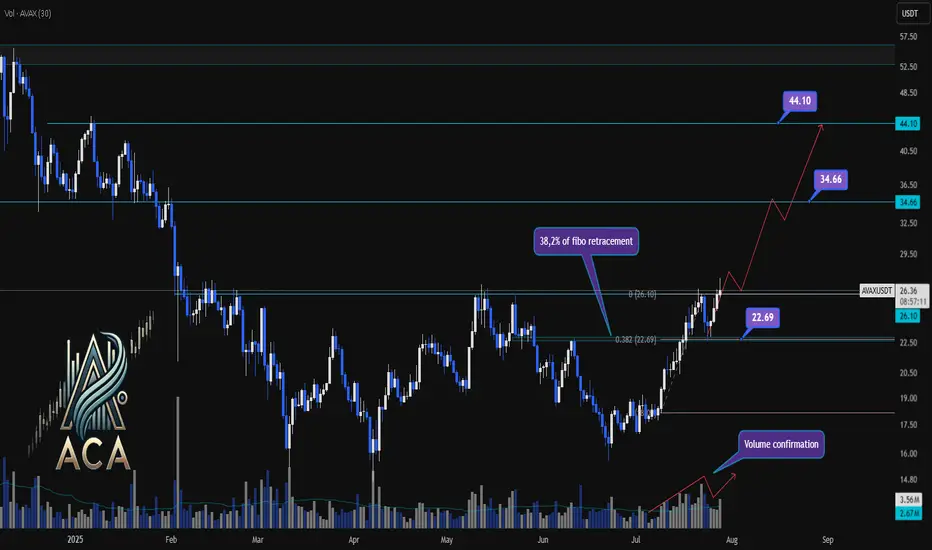
AVAXUSDT Trend Analysis | Will Volume Confirm the Next Big Move?AVAXUSDT Trend Analysis | Will Volume Confirm the Next Big Move?
🔍 Let’s break down the AVAX/USDT setup, examining its technical structure and mapping out key opportunities as it gears up for a decisive move.
⏳ Daily Overview
AVAXUSDT has been exhibiting a bullish structure, recently reacting to the 0.382 Fibonacci retracement level (around 22.69USDT) where price paused for a correction. This correction was technically healthy, as it occurred with declining volume, while upward impulses were marked by notable volume surges—signaling strong bullish participation and confirming accumulation phases.
🔺 Bullish Scenario:
The next area to watch is the resistance at 26.10USDT, which has acted as a major barrier in recent trading sessions. A decisive daily close above this level—preferably supported by a clear uptick in volume—would confirm breakout momentum and set the stage for further advances.
Upon confirmation, the chart points to medium- and long-term targets at 34.66USDT and eventually 44.10USDT. These levels are derived from key Fibonacci extensions and historic price reactions, offering logical take-profit zones for trend-following strategies.
📊 Key Highlights:
- 0.382 Fibonacci level (22.69USDT) acted as a reaction zone and healthy correction point.
- Volume profile validates trend: increased buying volume during upswings, decreased volume on dips.
- 26.10USDT is the next crucial resistance for confirmation.
- Breakout (with volume) opens path to 34.66USDT and 44.10USDT targets.
- Failure to clear 26.10USDT could result in consolidation or another retest lower.
🚨 Conclusion:
All eyes are on the 26.10USDT resistance. Wait for a clear daily close and volume confirmation before considering entries. A breakout above this level could propel AVAXUSDT towards higher Fibonacci targets, while a rejection may prompt another retest of prior supports or consolidation.
Stay sharp and plan your trades with discipline!
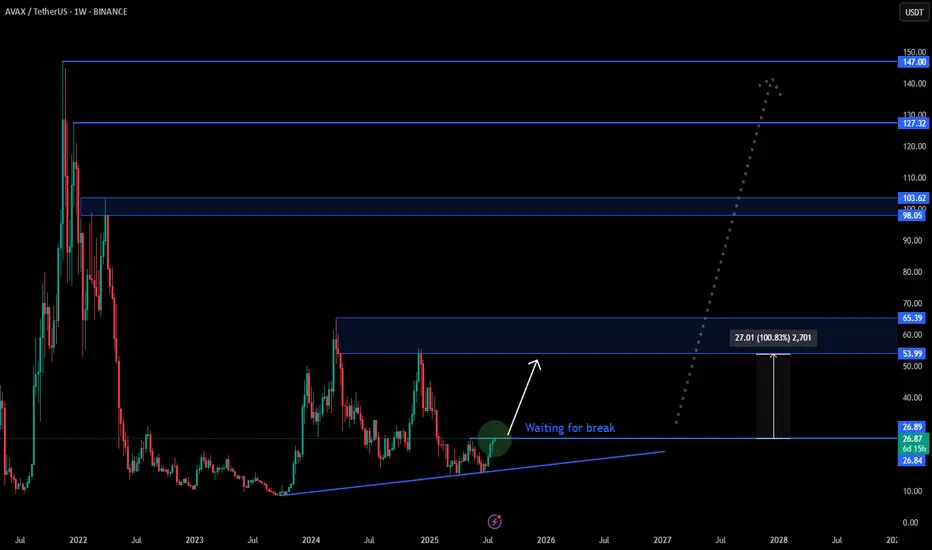
AVAX | Full Analysis Here is the top-down analysis for AVAX as requested 🫡
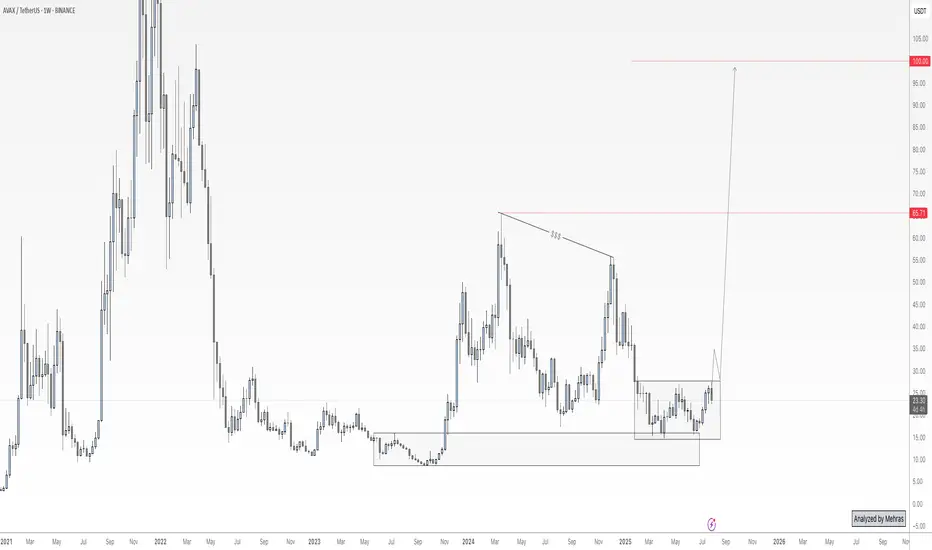
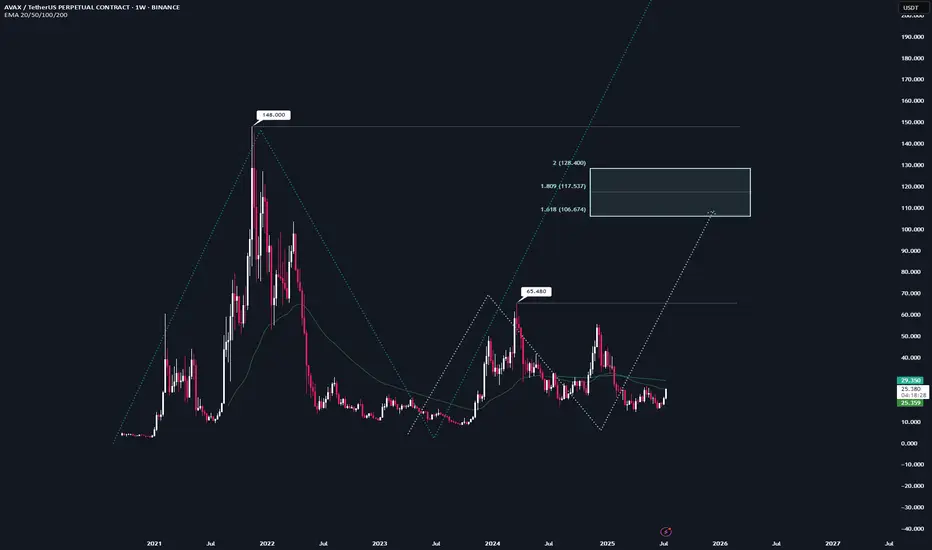
Weekly Timeframe:
We currently have two potential bullish structures on the weekly chart, but neither has been activated yet.
The first one (light turquoise) will be activated once we break the local high at $65. Until then, there's no valid trade setup. This sequence has it target range at $106–128.
The second structure (turquoise) gets activated once we break the all-time high at $148. It then targets the $242–298 range, which also represents my conservative bull run targets for $AVAX.
On the weekly chart, the strategy is to HODL. I wouldn't buy at this point, and I definitely wouldn't sell—because if we see another altcoin season (which in my view is nearly guaranteed), there's no reason AVAX shouldn't reach its targets around $242.
I would personally start taking profits at $106, then again at $148, and be fully out at $242.
Daily chart:
Here we have a potential structure that will be activated once we break the recent high at $26.
From that point on, according to the rulebook, every pullback into the B–C correction level (Fib 0.5–0.667) becomes a tradable opportunity.
Local Priceaction:
Three days ago, we successfully broke through the bearish reversal zone (red) and reached the bullish target zone (turquoise).
Now, every pullback into the B–C correction area becomes a valid long entry. If the price turns around and reaches that area again, I’ll trade each level with a stop-loss just below the next key level.
--------
Thats the my full Analysis for CRYPTOCAP:AVAX , hope it was helpful if yall have anymore questions feel free to ask, and if you want me to do another analysis for any other pair just comment down below.
Thanks for reading❤️
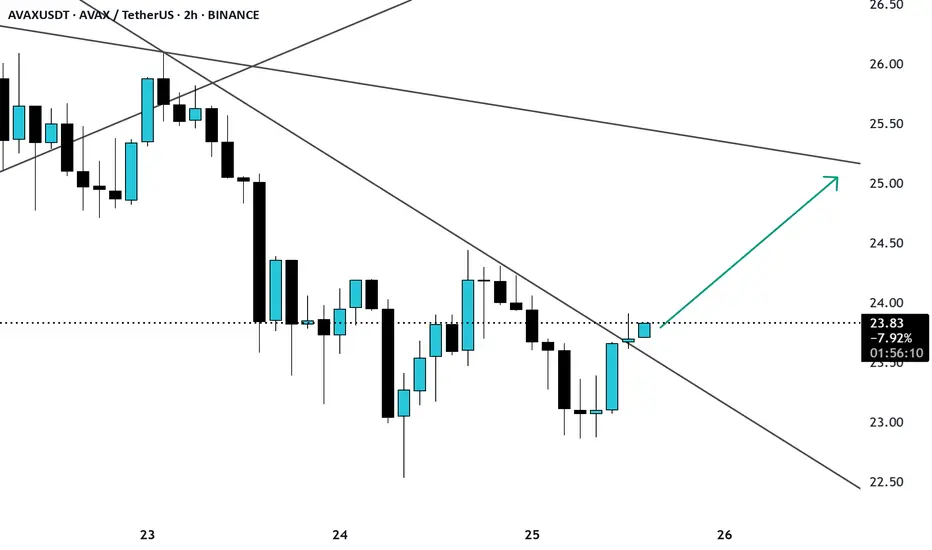
AVAX break of trendline resistance AVAX/USDT is showing a strong breakout attempt on the 2H timeframe, breaking above a descending trendline after multiple rejections from the $23.00 zone.
AVAXUSDT 8H — Trendline Break Confirmed, Retest in ProgressAVAX just closed above a 7-month macro downtrend and is now pulling back into a high-confluence retest zone. With the prior trendline now acting as potential support — and price holding above a multi-tap demand level — this is a high-stakes inflection point.
📊 Technical Breakdown:
Breakout:
The descending trendline that defined AVAX’s entire bear structure since January has finally broken. A clean candle close above that line marked a shift in control from sellers to buyers.
Retest Zone:
Price is now sitting directly on top of the broken trendline and the horizontal demand zone that’s held since Q1. This dual-level confluence offers a high-probability bounce area — or a decisive invalidation if lost.
Momentum Check:
Stochastic RSI is resetting — not overbought — giving bulls room to push higher if this retest holds.
Targets to the Upside:
$30 – Local breakdown zone from late Jan
$38 – Pre-capitulation base (March)
$44 – Major structural resistance
$52–53 – Full retracement target from the December high
🧠 Trade Context & Bias:
Bullish case:
A bounce here with strong volume confirms the trendline flip and opens the door for midterm continuation toward the $38–$44 zones.
Bearish case:
If AVAX breaks below $22 with momentum, this would invalidate the breakout structure and shift bias back toward range-bound or bearish continuation.
This is where structure meets opportunity. A successful retest could place AVAX at the front of the next altcoin rotation — but only if buyers defend this level with conviction.