AVAX Potential BuyMEXC:AVAXUSDT.P price is in a 4h bullish trend and right now making a correctional move to a discounted zone but we can clearly see market structure shift in 1h time frame so we are waiting to this internal bullish trend to be confirmed then we can look for potential buys to all those trend line liquidities and potentially a bearish micro trend at top of that strong high
AVAXUSDT trade ideas

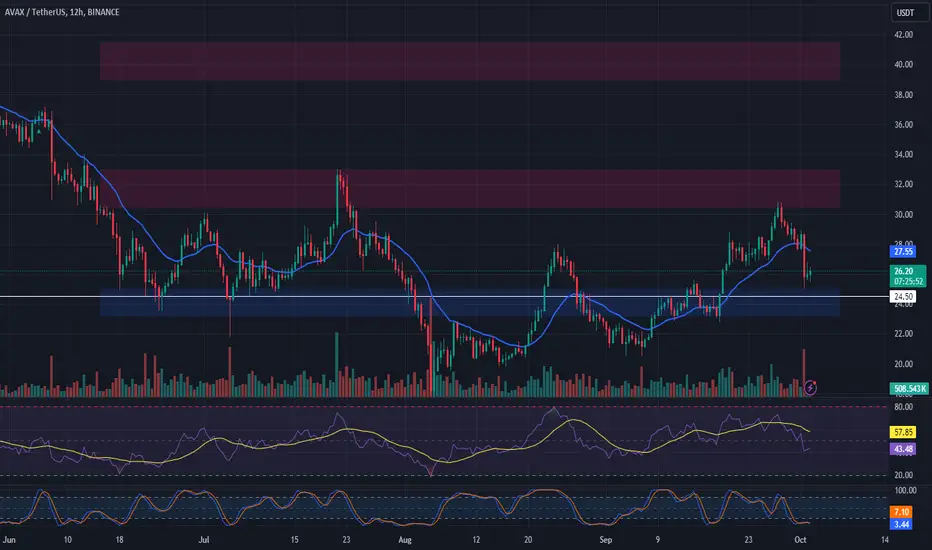
AVAX shortAVAX broke trough off the lower boundary of ascending channel. Asset broke trough the support level. Bearish movement to support level at 25.2 is expected to happen.

avax weekly analysafter starting an uptrend movement from 16 oct 2023 candle to 18 march 2024 we have a deep correction to the fibo 0.78 level . on this level support was done and the breaking up happened by candle 16 sep 2024. we expect that avax again test the first support line at the fibo 0.78 level and then try to break up the static resistance candle 15 july 2024. by passing through this area the taget will be again the candle of 18 march 2024

Crypto in October is "UPTOBER" by OfficialPapaRicoThere was an imbalance on the 4-hour chart that also bounced right off the 61% level. This is a long-term trade and will hopefully break new highs within the next 6 months to 4 years.
This is not financial advice but I would highly invest in buying crypto and storing it in a cold wallet. CryptoBubbles.net is also a great platform to see the top 1000 coins to invest in. This is a great time to invest in at least 10 different coins.
Good luck guys and see you next year in 2025
- OfficialPapaRico
- October 6, 2024

AVAX BULL TO $74It appears that if Bitcoin does not enter a bearish phase, we will experience an altcoin season, presenting optimal long entry opportunities with minimal stop-loss requirements.
Therefore I see AVAX going to $74

AVAXUSDT | We might only see a breakout toward 2025In the short term, I am expecting AVAX to push up as it found support at the bottom of the rising channel it currently finds it self in. Looking at the RSI we can see that AVAX is about to breakout at the top of the range and could push the price up to 43.35 towards year-end however I am only seeing AVAX breaking out of the bigger triangle in 2025

Is AVAXUSDT About to Crash? Here's What You Need to Know!Yello, Paradisers! Are you keeping a close eye on AVAXUSDT? We’re seeing bearish signals that could indicate a major move down! 📉
💎Currently, AVAXUSDT is forming a classic Head and Shoulders pattern from a key resistance zone—a strong indication of a potential bearish reversal. 🧐 On top of that, we’ve spotted a Change of Character (CHoCH) confirming a bearish market structure, further tilting the probability to the downside.
💎But that’s not all. If AVAXUSDT pulls back and we see an Internal CHoCH (I-CHoCH) on the lower time frames, it will strengthen the bearish sentiment and signal an entry opportunity. In this scenario, the right shoulder could develop on the higher time frame.
💎Don’t forget, there’s a supportive trendline nearby that could cause some price reactions. Manage your positions carefully and don’t get caught in a false breakdown.
💎However, if the price shows strength, breaks above the resistance zone, and closes a candle above, it will invalidate our bearish outlook. In this case, it’s a clear no-trade zone until we see a decisive break in either direction.
🎖With the markets always throwing surprises, remember: Stay patient and wait for the highest probability setups. Discipline is key to consistent profitability.
MyCryptoParadise
iFeel the success🌴

AVAX Long Spot Position (Support Entry)Market Context: AVAX has retraced to a key support level between $23.00 and $25.50, offering a strategic entry point for a long trade as it shows potential for a bounce.
Trade Setup:
Entry: In the current $23.00 - $25.50 level of support.
Take Profit:
First target: $30.50 - $33.00
Second target: $39.00 - $41.50
Stop Loss: Just below $24.50.
This trade aims to leverage the support level for a potential upward movement, maintaining a favorable risk-reward ratio. #AVAX #SupportTrade
#AVAXUSDT #4h (Bybit) Ascending channel breakdownAvalanche lost 50MA acting as resistance now, seems to be heading towards 200MA support.
⚡️⚡️ #AVAX/USDT ⚡️⚡️
Exchanges: ByBit USDT
Signal Type: Regular (Short)
Leverage: Isolated (7.0X)
Amount: 4.9%
Current Price:
28.095
Entry Targets:
1) 28.435
Take-Profit Targets:
1) 25.140
Stop Targets:
1) 30.085
Published By: @Zblaba
CRYPTOCAP:AVAX BYBIT:AVAXUSDT.P #Avalanche #Web3 avax.network
Risk/Reward= 1:2.0
Expected Profit= +81.1%
Possible Loss= -40.6%
Estimated Gaintime= 1 week

Avalanche (AVAX) Bearish Short-TermI will keep this one simple as I am just answering a question for one of my followers.
Avalanche is one of the Crypto-giants. We are looking at AVAXUSDT on the daily timeframe.
We have the same pattern of lower highs on this chart. A bearish trend because we also have lower lows.
Trading volume has been dropping since November 2023. These are the general signals that support a bearish bias.
Now, on the short-term, AVAXUSDT recently produced a price bounce. This bounce peaked before hitting MA200 (clearly shown on the chart). The fact that MA200 was not challenged as resistance means that the bulls are weak. The bulls being weak means that prices need to go lower before another attempt at going higher. Going lower can signal a lower low compared to 5-August because we have a lower high on the price bounce. A lower low can indicate a major drop coming next because the last low was 17 and a lower low would need to move to around 11-13 minimum.
It is still early of course but this is what the chart is saying now.
The lack of bullish strength is a major bearish signals. Since the bulls did not show up, then the bears will take full control of the chart. If the bulls were not able to move higher on this wave, then the market needs to look for liquidity and higher is not possible and thus it moves lower... Up and down, up and down. Down goes next.
Thank you for reading.
I hope this answers your question.
I hope you find the content entertaining.
Namaste.

AVAXUSDT.1DIn my technical analysis of the AVAX/USDT daily chart, I'm focusing on the recent price action which suggests a bullish trend. After hitting a low around $17.29, AVAX has shown significant recovery, forming a solid ascending trendline that indicates sustained buying pressure.
The recent price action has taken AVAX to a key resistance level at R1 ($33.18), where it is currently testing this threshold. A break above this level could see the price move towards R2 at $38.98, which represents a previous high point and a psychological resistance level.
Support levels are crucial in my analysis to gauge where the price might find a floor if a pullback occurs. S1 at $26.89 and S2 at $17.59 represent critical zones where buyers previously stepped in. A drop below S1, however, would require me to reassess the bullish scenario, while S2 offers a stronger historical support level that might serve as a robust fallback if a more significant retracement unfolds.
From a technical standpoint, the Stochastic RSI is nearing overbought territory, suggesting potential for a short-term pullback or consolidation before further upward movement. Additionally, the MACD histogram shows decreasing momentum, which aligns with the need for cautious observation of price action near these critical resistance levels.
Given these observations, my strategy involves closely watching the reaction at R1. A decisive close above this resistance with increased volume would confirm the strength behind the current uptrend and could provide a favorable opportunity for a long position aimed at R2. Conversely, should AVAX fail to breach R1 and shows signs of reversal, I would consider securing profits and preparing for a possible re-entry at lower support levels.

AVAX IMPULSE WAVE #AVAX #LONGTERM #MONTHLY
"On the monthly timeframe, the coin is bouncing off the main support at $20. I also believe that the monthly candle close will be an engulfing candle.
Main target: $100 to $250.
The $500 target is a major goal that may or may not happen under certain conditions and significant market news."
STOP LOSS : 17$
"The recommended holding period for the coin is 6 to 9 months."

AVAX Hidden bullish divergence Dear reader,
I can see an hidden bullish divergence on Avax on 1month timeframe. I saw more on lower timeframs.

BULLISH AVAX OCTOBER**Expect prices to surge into the high $40s to upper $70s range.**
**Our bullish sentiment is through the roof!**
**The upcoming AVAX Summit is poised to be a game-changer.**
**Avalanche ( CRYPTOCAP:AVAX ) is currently significantly undervalued.**


Closing AVAX position and taking profits. CRYPTOCAP:AVAX #AVAX #AVAXUSDT #AVAXUSD
Closing AVAX position and taking profits.
I am not sure about market's stability. Too much green days. BTC seems like it can do one of those sharp selling day.

$AVAXCRYPTOCAP:AVAX make or break levels. We can easily hit $100 soon. i will be Dollar Coast Averaging into this position with no hesitations. BINANCE:AVAXUSDT

[AVAXUSDT] - bullish patternAvax coin is one of the most important coins in layer1, layer2 tokens
Now it's so close from weekly close ... it's bullish incase of breakout.
The lowest target is at march top (63$)
Best regards cecilion🎯

AVAX scalp in H1📊 Analysis by AhmadArz:
🔍 Entry: Wait for a bullish confirmation around $26.80.
🛑 Stop Loss: Below $26.45.
🎯 Take Profit:
- TP1: $27.46 (Close 50% position)
- TP2: $28
- TP2: $28.88
- Re-entry: Consider around $25.00 for another position.
---
🔗 "Uncover new opportunities in the world of cryptocurrencies with AhmadArz.
💡 Join us on TradingView and expand your investment knowledge with our five years of experience in financial markets."
🚀 Please boost and 💬 comment to share your thoughts with us!

TOP ANALYSIS SIMPLIFIED FOR AVAX AND ITS OPPORTUNITIESA look into AVAX and its opportunities and likely zones to watch out for entries.
tradehubng

AVAXUSDT Elliott Waves Analysis (Investment idea)Hello friends.
Please support my work by clicking the LIKE button👍(If you liked). Also i will appreciate for ur activity.
Everything on the chart.
Nothing has changed from my last idea.
Entry zone: 25 - 20
Targets: 75 - 150 - 200 - 250
Investment target zone: 250-300
after first target reached move ur stop to breakeven
Stop: (depending of ur risk).
ALWAYS follow ur RM
risk is justified
It's not financial advice.
DYOR!

$AVAX #AVAX #AVAXUSD #AVAXUSDT Closing in to TP1AVAX Closing in to TP1, a minor resistance but you could put 30% of the position to your pocket.

#AVAX/USDT#AVAX
The price is moving in a descending channel on the 4-hour frame and is sticking to it very well and is expected to break it upwards
We have a bounce from a major support area at the lower line of the channel at a price of 23
We have a downtrend on the RSI indicator which supports the rise
We have a trend to stabilize above the moving average 100
Entry price 23.69
First target 24.81
Second target 25.70
Third target 26.86
