AVAX/USDT Potential continuation the upward movement for AVAX!💎 AVAX has recently shown significant market dynamics, rebounding from the support area, suggesting a potential continuation of its upward movement towards the resistance level around $65.5.
💎 This resistance area corresponds to a previous higher peak, and a breakout above it could pave the way for further gains, the probability of reaching our target supply zone area.
💎 However, if AVAX faces rejection at the resistance area, there's a possibility of a retracement to test the support region between $50 and $47.
💎 When AVAX approaches the support area, it's essential for it to bounce, given the area's significance. Failure to hold this support level could lead to further downward movement, potentially testing lower support areas. If AVAX breaks below this support, along with the trendline support, it would confirm a bearish trend, signaling further downward movement.
AVAXUSDT trade ideas

Avax potential resistance level at $61.50currently trading at $57.77, watching a potential resistance level at $61.50 in the daily time frame.
If AVAX can surpass this resistance level, it could signal further bullish momentum for the token. However, if it fails to break through, it could face some selling pressure in the near term.

Avaxusdt trading opportunityAvaxusdt is approaching a significant supply area, and we anticipate this resistance level to exert downward pressure on the price for a period.
We expect a rejection from this zone, and the immediate demand area presents a favorable buying opportunity. In the event that this level fails to hold as a weak support, our focus may shift to the critical demand zone, which we believe will be vigorously defended by bull.
Both areas share the same target as indicated on the chart, with the $110 price level poised for significant pressure once the price breaches the immediate supply zone.
We value your engagement and welcome your feedback on our analysis.
Thank you.

Avalanche's Memecoin Rush Sparks Debate Amidst $1M InjectionThe recent announcement of the Avalanche Foundation's Memecoin Rush initiative, injecting $1 million into the ecosystem to catalyze community coin adoption, has ignited both excitement and skepticism within the cryptocurrency community.
While the initiative aims to incentivize trading and liquidity provision for selected community tokens such as Kimbo ($KIMBO), Gecko Inu ( LSE:GEC ), Coq Inu ($COQ), TECH, and NOCHILL, some critics argue that it could exacerbate speculation and volatility in the market.
The decision to kick off Memecoin Rush with prominent platforms like SteakHut and Trader Joe has raised eyebrows, with questions emerging about the criteria used to select participating tokens. Concerns linger over the potential for manipulation and pump-and-dump schemes, especially considering the recent proliferation of meme coins in the crypto space.
Furthermore, the Avalanche Foundation's acquisition spree of community coins, fueled by a portion of its $100 million NFT incubator fund, has drawn scrutiny. While positive social sentiment, significant holders, liquidity, and project maturity were cited as criteria for token selection, some observers remain skeptical about the Foundation's motives and the long-term sustainability of meme coin projects.
Eric Kang, BD Manager at Ava Labs, emphasized the importance of meme coins in the web3 space, describing them as a cornerstone of cultural expression within crypto communities. However, skeptics argue that meme coins often lack intrinsic value and may contribute to market instability, raising concerns about investor protection and regulatory scrutiny.
As Memecoin Rush unfolds, it will be crucial to monitor its impact on the Avalanche ecosystem and broader cryptocurrency markets. While the initiative aims to foster broader support and adoption for Avalanche-native tokens, critics caution against the potential risks associated with meme coin speculation and the need for responsible governance measures to ensure market integrity and investor confidence.


Clear Bullish Setup, Expect a New Impulsive Move Soon👉 The Price Sitting Above The Important Trend Line And Also There Is a Bull Flag Is On The Table, Expect a Breakout From The Bull flag And Start a New Bullish Move Toward a 69$ In a Short Term

Cryptolean Avalanche AVAX UpdateAvalanche is holding the support zone of $52-$54.
A move towards $60 and a bullish break-out with another daily candle closure above $60, the key daily resistance, will push AVAX price higher towards $64-$67 and higher to $72 .
A bearish dip to below $52 will result in a decline to re-test $47-$49, the key daily support.
Below $47 is the daily range zone where we will see another rangebound price action.

Avax Up to 27 % Or Dump to 16% !?Diamond Pattern Analysis
After breaking the upward trendline, a downward movement can be expected. The first target is $44 and the second target is $35.
If the downward trendline breaks, an upward movement towards higher numbers can be expected. The first target is $69 and the second target is $81.
It is crucial to set a stop-loss because this pattern doesn't always work accurately.
Remember, this is solely an analysis, and your profit and loss are your own responsibility.

FALLING WEDGE FORMING? A falling wedge pattern is a bullish chart pattern that usually forms during a downtrend, indicating a potential reversal. If AVAX (Avalanche) is forming a falling wedge pattern, traders may look for opportunities to enter bullish positions. Here's a trade idea based on this scenario:
AVAX Falling Wedge Bullish Trade Idea:
Pattern Observation:
AVAX has been in a downtrend, characterized by lower highs and lower lows.
A falling wedge pattern is forming, marked by converging trendlines sloping downward.
The falling wedge pattern typically indicates a weakening downtrend and potential bullish reversal.
Personally i may consider entering at 0.618 (53.765)
or
Just wait for pattern to breakout

AVAXUSDTmy entry on this trade idea is taken from a point of interest below an inducement.. I extended my stoploss area to cover for the whole swing as price can target the liquidity there before going as i anticipate.. just a trade idea, not financial advise

t h e a v a l a n c h e🗻last few ideas:
---
you know why they call it the avalanche?
because when it falls, it falls hard.
you ever try stopping an avalanche?
well you can't.
that's what comes next.
t h e a v a l a n c h e.
---
avax is working on a macro double zig-zag, and is poised for a large push down in the months ahead. we could easily stay lingering around at these heights for awhile, but when it breaks, it'll take everything, quickly.
---
🍒


AVAX Megaphone updateAVAX decided to push to the upside and I am glad that I averaged on that bottom support line. I will admit once the fed dovishness arrived I did deploy the rest of my stables into AVAX and INJ before liftoff. I had been DCAing a few select alts including AVAX on this latest flushout.
-My bags have been packed, but I did get some tokens at a discount by selling more volatile setups like JOE into stables last week
-70$ is the more likely direction here as this megaphone expands, I expect a test to the top teal line within 3-4 days here, this invalidates my temporary bearishness, this is also why daily and weekly charts reign supreme

AVAX Long IdeaI've just got into Avax and my last trade I had in it I took from 38 to 56 and now since it hit the daily low of 53.2 and im expecting some rejection here and as you can see in the post those are my long position ideas for TP. this is not financial advice and as always trade responsibly.

Avax expansion of volatilityAvax had a really powerful move recently before this downturn in BTC. My short term target was hit, which generally means I stop buying for a bit as a local top is likely in. I have taken this opportunity to average in on this base, this expanding wedge or asymmetrical megaphone presents a problem though. Note the break of OBV to the downside, if this is not just a flush this is bearish. Given that this is just a 4-hour chart we could see more downside to the purple long-term trend line. If BTC really dumps I think we could see 41$ again.
-In summary, I am very conflicted on direction here, BTC decides where we go. An expanding pattern such as this means more volatility than we have seen.
-A high of 70 if AVAX depegs from BTC
-A low of 41 with a more likely retest of 48 is most likely.

AVAXUSDT - In Bullish TrendAVAXUSDT is trading in bullish trend making higher highs and higher lows.

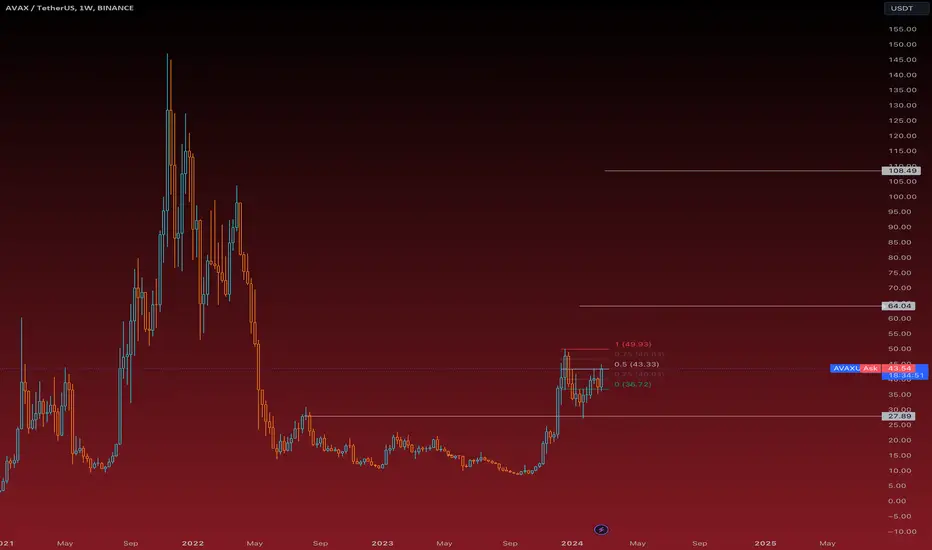
Where does it go?(AVAXUSDT W)BINANCE:AVAXUSDT The expected target is visible on the chart. If a second target is provided, it is likely to be achieved.

AVAX Pice Update
The price is moving up in a channel pattern, but it's facing resistance at the trendline. If it breaks above and then retests the trendline, it's usually a bullish sign. However, if it fails to break through, it could mean a possible market correction.

avax short hello Traders, here is the full analysis for this pair, let me know in the comment section below if you have any questions, the entry will be taken only if all rules of the strategies will be satisfied. I suggest you keep this pair on your watchlist and see if the rules of your strategy are satisfied. Please also refer to the Important Risk Notice linked below.

AVAX - Target $100 - 49% increase - Cup and handle break outHello, AVAX looks to break out from a cup and handle pattern and can potentially increase up to $100 which is an increase of approx. 49%.

