AVAX/USDT is rebounding from support line..1-hour chart, the crypto price is trading in a falling wedge. Tested the support line S and rebounded. It should test the Resistance line R.
After crossing, and closing for 3 candlesticks above R, the target will be 41.8 extending to 43.6
Stop loss below Support line S.
AVAXUSDT trade ideas

Potential short for AVAX/USDT? Looks like avax may do a pump to my buy target at the chart, making it a good short opportunity as long as it does not hit the profit target before it goes up.
Again i would not enter now for a scalping
rsi showing down
while oscillator having a small upside potential giving us a opportunity for a short trade.

Avalanche is seen in a rising wedge4-hour chart, I see this crypto as trading in a rising wedge (almost a channel), and heading upwards to 45 in few days.
RSI techn. indicator is supporting this view.
Stop loss below support line S

Avalanche(AVAX): Rejected From Bollinger BandsAvalanche is showing us some rejections near the upper line of Bollinger Bands, which pushed the price back, but is not leading it towards the middle line of BB.
We are monitoring for price to reach that line there and most likely break it as well!
Swallow Team

AVAX Macro Potential Bull Run TargetsAs the market reaches an important pivot point in both time and price, we are looking at major rejection or a major rally.
Currently there has been no macro brakes of structure and prices have been continuting to rise. While these pivot points bring excellent short oppertunites the trend is still to the upside until it is not.
Looking at the Avax weekly we can see that a mesured move target is aligning quite nicely with the time factor given by the wave trend oscillator. Money flow is still in the red but is curving to the upside after a bounce off a critical support resistance flip.
Also notice that price is in the macro golden pocket and if the entire market wants to reverse to the down side this would be the place. For now the trend is intact and always best to trade the trend until it ends.
Current trading plan is to hold long until there is a clear brake of structure on the higher time frames or these macro high targets have been reached.
This chart is a supplement to the projections made earlier this year in the linked chart below.
Trade Well...
Your Friend,
Degen

Avax Short Term TradeHello community!
Avax:
1. Has strong level
2. Has accumulation base which is good to have clear stop loss.
3. Has potential space for growing till 39.45

AVAXUSDT 1H TF (H&S Reversal, Divergence & break of neckline)AVAXUSDT shows a bearish momentum based on:
(1) Bearish Divergence (1H)
(2) Head & Shoulder Reversal
(3) Break of H&S neckline
Trade Plan
SL: Previous LH
Entry: CMP
TP1 and TP2: 1:2 risk to reward.
What do you think, will it work?

Avax long Target 1: 50$ and Target 2: 68$Avax ( COINBASE:AVAXUSD ) nice breakout
1. Supertrend positiv
2. positiv accumulation
3. positiv squeeze
long Target 1: 50$ and Target 2: 68$

Avaxusdt ,,,, technical analyst In the short term, after crossing the 42500 resistance, it reaches the specified areas respectively, you can target the average of these areas in the short term, but if it fails to cross the resistance area. It will correct and then continue to climb.

Avaxusdt ..technical analyst By crossing the resistance zone, around 42, the price , will grow to the upper zones, which I specified the targets on the chart.

AVAXUSDT BUY-During this period, the currency has been growing rapidly, this growth can continue, therefore, we can activate buying in the right situation.

$AVAXUSDT 1DBINANCE:AVAXUSDT 1D
#AVAX posts denial to fall yesterday the current level is $41.35. #AVAX recently broke UP above the month-long downward corrective price channel wherein the price fell to (-43.34%). However, it has already managed to recover more than half of what it lost UP by (26.91%) and the recovery may continue till the price hits $48.
Nevertheless, it's worth mentioning that #AVAX has historically seen a lot of resistance in the zone above $48 - $54.
Short Term BULLISH! Will keep tracking during and post $48 - $54.
DYOR (DO YOUR OWN RESEARCH)
Hit 🚀 if you guys want more pairs analysis.
#AVAXUSDT #crypto #marketpdates #thesoumyoroyanalysis


AVAX - If We Break The Lows We Head Lower....An observation on the chart that may pique interest: You could consider shorting this market.
If so, await a breach below $38.38 and target $33.65, setting a stop at $39.14 if it continues to resist without surpassing.
In that case, consider the last high made by the mini Wave E.

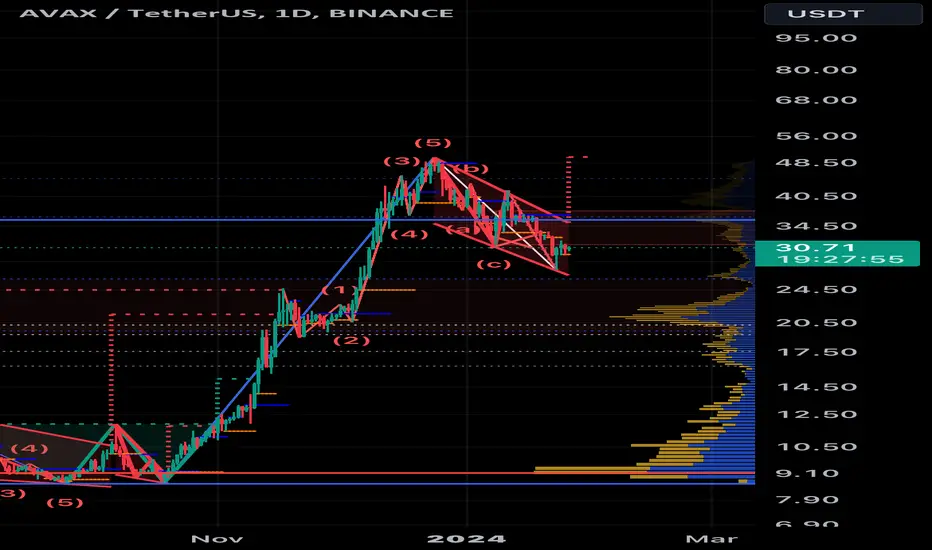
✴️ Avalanche Wave B Is Over, Set To Move LowerI think Wave B is now over and Avalanche is set to resume moving lower.
We are looking at a Zig-zag correction.
➖ Wave A is the first drop while wave B is a lower high compared to the start of wave A.
➖ Wave C should end the correction and finish as a lower low compared to wave A.
➖ Trading volume continues to decrease;
➖ The RSI already peaked;
There is potential for lower prices.
See the "Related ideas" below for additional information on this bearish move for Avalanche (AVAXUSDT).
Needless to say, we are short for the duration of the bearish wave.
Namaste.

AVAX Inverse Head & ShouldersAVAX looking for a possible pullback ( 4hr time frame )
level to break around 41.34 for entry ( add on retest )
( the Inverse Head & Shoulders - is ugly but I know traders see this )
Not recommended to front run the breakout
the recent pump was about 23%
a retracement would be healthy
currently RSI is in overbought territory
and would like to see more volume come in with breakout
Alert set at 42.20 level / price

New ATH AVAX weekly based on historical fib extensionIf history repeats itself and AVAX remains fundamentally strong then I could imagine this desirable scenario :-) It is based on the same fibonacci extension levels as those of the first- and the second ATH in 2021. I have extended these levels to the future in mid-2025. There is also a hidden bullish divergence visible on the weekly chart.

AVAXThe price chart for CRYPTOCAP:AVAX shows growth potential. If it confirms a breakout above the indicated blue zone, an entry point around $37.52 could be favorable. It's essential to use a stop-loss for risk management.
Everything is on the chart. All the targets are marked.

Avax possible bullflag The recent price action of AVAX shows a consolidation period following a strong upward move, forming a pattern resembling a flag.
A breakout above the upper trendline of the flag could signal continued bullish momentum, potentially pushing the price towards targets around $37-$40 based on the flagpole height.
Increased trading volume often accompanies breakouts, further strengthening the signal.
Cautious considerations:
Technical indicators alone shouldn't be the sole driver of investment decisions. Fundamental factors like the overall market sentiment, upcoming news events, and on-chain data for Avalanche also play a significant role.
The cryptocurrency market remains volatile, and unexpected swings can occur despite technical patterns.
False breakouts are also possible, where the price briefly surpasses the flag's upper trendline but then falls back, potentially leading to losses.
Overall:
The potential bull flag on the AVAX/USD daily chart presents an interesting opportunity, but it's crucial to approach it with caution and consider all relevant factors before making any investment decisions. Conducting thorough research, using stop-loss orders, and diversifying your portfolio are key risk management strategies in the volatile cryptocurrency market.
AVAX retaking trendAVAX is back to the prior momentum trend line after the washout that alts saw. The token is one of my top 5 holdings and my strategy for this run is to take lots of my small cap profits into AVAX. I also plan on holding the majority of my stablecoins on the chain since they have native USDC. My medium term price target is 55$ right before the golden fib. There really is no price history until that point since the token went straight up and straight down through 50$.

AVAX inteligentassetIn our latest review, AVAX was exhibiting a bearish trend, characterized by lower highs and lower lows.
However, the trend has now shifted, with a daily candle closing above $37.5, indicating a potential change in momentum.
Bullish scenario
Key resistance levels to watch are at 41.6 (previous pivot high), followed by 48.18, 56.47, and 68.
bearish scenario
supports 38.26, 34.75 in 50 ema, 30.5, 27.8 pivot low

AVAX to go much higherAVAX came down to my buy zone and now ready to take off for the next leg up. The long term chart looks great for massive move to the 90 dollar range.
My next target is $52. And after that the door opens up for $93 to $100. I added to my longs at $34 dollars.
Not a financial advise. DYOR.

AVAXUSDT Elliott Waves (Investment Idea)Hello friends.
Please support my work by clicking the LIKE button👍(If you liked). Also i will appreciate for ur activity. Thank you!
Everything on the chart.
Main(investment) target zone: 250-300
Targets: 75 - 150 - 250
Cancellation of setup - consolidation under ~11
RR: 1 to ~35
risk is justified
Good luck everyone!
Follow me on TRADINGView, if you don't want to miss my next analysis or signals.
It's not financial advice.
Dont Forget, always make your own research before to trade my ideas!
Open to any questions and suggestions
