AVAX | Trade setup📌 After the reaction from the bearish target zones (blue), we've now activated a bullish sequence (yellow) in $Avax.
📊 Valid entries are currently forming during a potential B-C correction.
Trademanagement:
I'm placing long orders at each level.
Once the trade reaches a 2 R/R, I’ll move the stop-loss to break-even.
From a 3 R/R onward, I’ll start locking in profits.
Once I’ve locked in my first profits, I’ll share the next profit targets with you.
AVAXUSDT trade ideas

HolderStat┆AVAXUSD seeks to retest $17BINANCE:AVAXUSDT is pushing upward after a breakout from the falling channel structure, reclaiming the $17 support area. The short-term projection points toward $19, with upside potential toward $22 if the channel resistance breaks. Momentum is building from the breakout zone.

AVAX (Avalanche) Breakout? Here’s My Trade Plan.📊 Market Breakdown: AVAX/USDT (Avalanche)
Currently monitoring AVAX/USDT, and both the daily and 4-hour timeframes are showing a clear bullish break in market structure — a key signal that the momentum may be shifting to the upside.
That said, I’m not jumping in just yet. I’m only looking for long opportunities if specific criteria are met:
✅ A clean break above a key resistance level
✅ A retest of that level, followed by a failed attempt to move lower
If these conditions are confirmed, I’ll be watching for a high-probability entry from that zone.
🎥 In the video, I also walk through how to use several powerful TradingView indicators, including:
Volume Profile
VWAP
These tools help sharpen the edge and support decision-making in live market conditions. If the setup doesn’t materialize as expected, we simply stand aside — discipline is key.
📌 Disclaimer: This is not financial advice, just a breakdown of how I approach this potential opportunity.

AVAX/USDT Weekly Reversal Zone — Major Support Holding
🟨 CRITICAL ZONE (Key Support Area)
AVAX is currently trading within a major demand zone between $13.5–17.5, a historically strong support area that previously acted as the base for significant upward movements. Multiple weekly candles show rejection from this level, indicating buyer interest.
📊 Pattern Overview:
Double Bottom / Potential Triple Bottom:
The chart illustrates a clear double bottom structure, potentially forming a triple bottom, suggesting accumulation and reversal from the lows.
Bullish Projection Path:
The yellow arrow outlines a projected bullish impulse wave, targeting higher resistance levels if support holds.
📈 Bullish Scenario:
If AVAX maintains support at around $17.1:
1. Price may first test $20.25 (initial resistance).
2. A breakout above $20.25 could open the way to:
$24.98 (strong weekly resistance)
$32.75 (previous distribution zone)
$55.42 (major target/resistance zone)
3. In an extended bullish cycle, price could revisit:
$98.87, $110, and even $128.62 long term (2026+)
A confirmed breakout above $25 with strong volume would further validate the bullish case.
📉 Bearish Scenario:
If the $15–17 support zone breaks down:
1. Price could drop further to:
$11.00 (minor support)
$8.61 (historical low and weekly support)
2. This would indicate strong bearish pressure, potentially leading AVAX into a longer-term accumulation phase.
🔍 Conclusion:
This is a critical decision zone for AVAX. The technical structure shows signs of accumulation and possible trend reversal. However, if support fails, a deeper retracement could occur. Traders should watch this area closely for breakout or breakdown confirmations.
#AVAX #AVAXUSDT #Avalanche #CryptoReversal #TechnicalAnalysis #Altcoins #WeeklyChart #CryptoSupportZone #CryptoBreakout

Avalanche (AVAX): Signs of Upcoming Bullish MovementWe noticed a similar pattern, where each time after liquidity hunting near a local support area, we were entering into the next buyside movement, which might indicate that we are about to enter another one pretty soon.
We are looking for upward movement from this region, which would lead the RSI into overbought zones, giving us from there then an opportunity to short, but meanwhile we are longing!
Swallow Academy

Avalanche (AVAX): Price In Bullish Trend | Might Pump SoonAvalanche had another bounce from the bullish trend where we are getting more and more confirmation of the possible bounce that we might be seeing from here. There is not much to say but as long as we stay inside that bullish trend, we are good for long.
Swallow Academy

Avalanche (AVAX): Seeing Bullish Trend | Possible 30% MovementAvalanche has formed the bullish channel here, where we are at the lower side of that channel, which might be the bounce zone for us. We are keeping a close eye on this zone and as soon as we see some signs of recovery near this region, we will be looking for bullish movement, which could give us a good 30% movement.
Swallow Academy

AVAXUSDTCryptocurrency Futures Market Disclaimer 🚨🚨🚨
Trading cryptocurrency futures involves high risks and is not suitable for all investors.
Cryptocurrency prices are highly volatile, which can lead to significant gains or losses in a short period.
Before engaging in crypto futures trading, consider your risk tolerance, experience, and financial situation.
Risk of Loss: You may lose more than your initial capital due to the leveraged nature of futures. You are fully responsible for any losses incurred.
Market Volatility: Crypto prices can fluctuate significantly due to factors such as market sentiment, regulations, or unforeseen events.
Leverage Risk: The use of leverage can amplify profits but also increases the risk of total loss.
Regulatory Uncertainty: Regulations related to cryptocurrencies vary by jurisdiction and may change, affecting the value or legality of trading.
Technical Risks: Platform disruptions, hacking, or technical issues may result in losses.
This information is not financial, investment, or trading advice. Consult a professional financial advisor before making decisions. We are not liable for any losses or damages arising from cryptocurrency futures trading.
Note: Ensure compliance with local regulations regarding cryptocurrency trading in your region.
thanks for like and follow @ydnldn
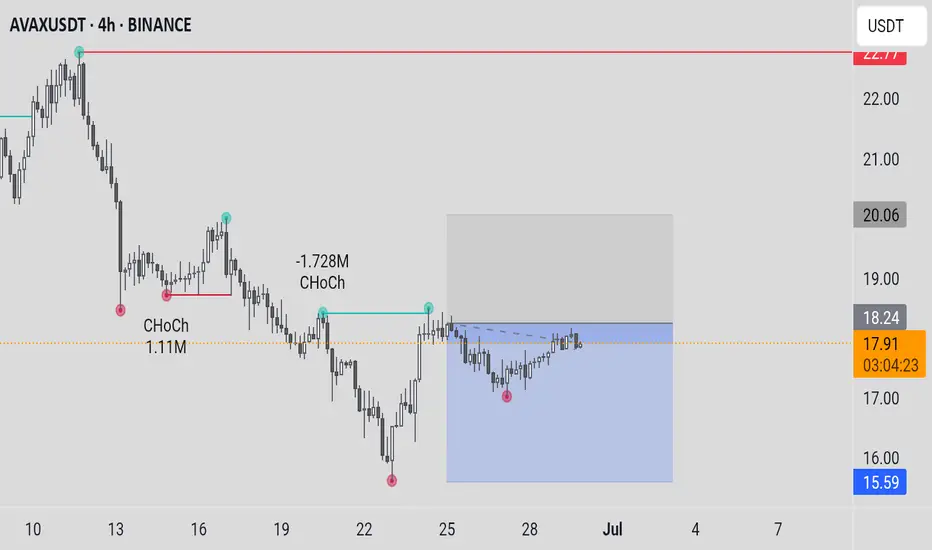
AVAXUSDT Short from Tight Range RejectionAVAXUSDT is showing signs of exhaustion near the resistance zone around 17.57, where price repeatedly failed to break higher. The market structure is consolidating with multiple wicks into the resistance zone, suggesting supply is stronger than demand at that level.
The current short setup is placed just below that resistance area, aiming for a breakdown from the consolidation. The stop loss is set above the most recent spike at 17.69, while the take profit is targeting near the trendline support at 17.21.
This setup banks on a reversal from the top of the range and offers a solid risk-to-reward.
🧩 Trade Parameters:
- Entry: 17.57
- Stop Loss: 17.69
- Take Profit: 17.21
🔢 Risk:Reward Calculation:
- Risk: 17.69 − 17.57 = 0.12
- Reward: 17.57 − 17.21 = 0.36
- Risk:Reward Ratio: 1 : 3.0 ✅ (Strong)
✅ Bias:
Short-term bearish; ranging top with lower highs
🔄 Confirmation Needed:
- Bearish engulfing or strong rejection candle
- Break below short-term support
- Weak volume on upside attempts
❌ Invalidation:
A clean breakout and hold above 17.69

Avalanche (AVAX): Second Successful Re-Test | Good Sell Entry?Avalanche coin recently had its second successful rejection from the neckline zone, which is giving us an opportunity to take a short position here.
With markets bleeding a little, AVAX coin has all the possibilities and chances to fall towards our lower target zone, considering that we are seeing a "double top" pattern forming here!
Swallow Academy

HolderStat┆AVAXUSD broke the resistanceBYBIT:AVAXUSDT on the 3h chart has confirmed a breakout from a falling wedge and is retesting $17.26. Price is now forming a higher low, with targets set at $20.50 and $23. This breakout structure supports continuation as momentum shifts back to buyers.

AVAX | At Critical JunctureAVAX presents a critical juncture on the weekly timeframe with two distinct scenarios playing out. The price action remains trapped between key levels, showing signs of weakness despite recent consolidation attempts.
The bearish path (red arrow) appears more probable given the prolonged downtrend and failure to establish meaningful higher highs. A break below the current support zone around $17.52 could trigger a significant selloff toward the lower green support area near $12-14, with potential for even deeper retracements.
The alternative bullish scenario (green arrow) would require a decisive break above the orange resistance zone around $28-32 to gain credibility. However, the overall chart structure suggests limited upside momentum.
Key levels to monitor:
Critical support: $17.52 (current price)
Breakdown target: $12-14 zone
Resistance to reclaim: $28-32 orange zone
Risk management is crucial given the binary nature of this setup.

#AVAX/USDT#AVAX
The price is moving within a descending channel on the 1-hour frame and is expected to break and continue upward.
We have a trend to stabilize above the 100 moving average once again.
We have a downtrend on the RSI indicator that supports the upward move with a breakout.
We have a support area at the lower limit of the channel at 17.22, acting as strong support from which the price can rebound.
Entry price: 17.54
First target: 17.92
Second target: 18.22
Third target: 18.62

AVAX Analysis (1D)From the point where we placed the red arrow on the chart, it seems a correction has begun.
This correction appears to be a Diametric pattern, and wave E does not seem to be complete yet. It's expected that wave E will finish within the green zone.
The target could be the red box area.
A daily candle closing below the invalidation level would invalidate this analysis.
invalidation level: 10.90$
For risk management, please don't forget stop loss and capital management
When we reach the first target, save some profit and then change the stop to entry
Comment if you have any questions
Thank You

Lingrid | AVAXUSDT strong REBOUND from the SUPPORT zoneCRYPTOCAP:AVAX is rebounding from the lower boundary of its descending channel after a deep sweep into the buying area near 17.00. The price formed a local bottom and is attempting to reclaim the 17.45–18.50 resistance band, hinting at early bullish intent. If buyers sustain this recovery, a test of the 20.00 psychological barrier could follow.
📈 Key Levels
Buy zone: 16.20–17.00
Sell trigger: breakdown below 15.80
Target: 20.00
Buy trigger: breakout and retest of 18.50 resistance
💡 Risks
Failure to break 18.50 may trap longs below key resistance
Breakdown from support invalidates current bullish setup
Broader downtrend still dominant unless 20.00 is reclaimed
If this idea resonates with you or you have your own opinion, traders, hit the comments. I’m excited to read your thoughts!

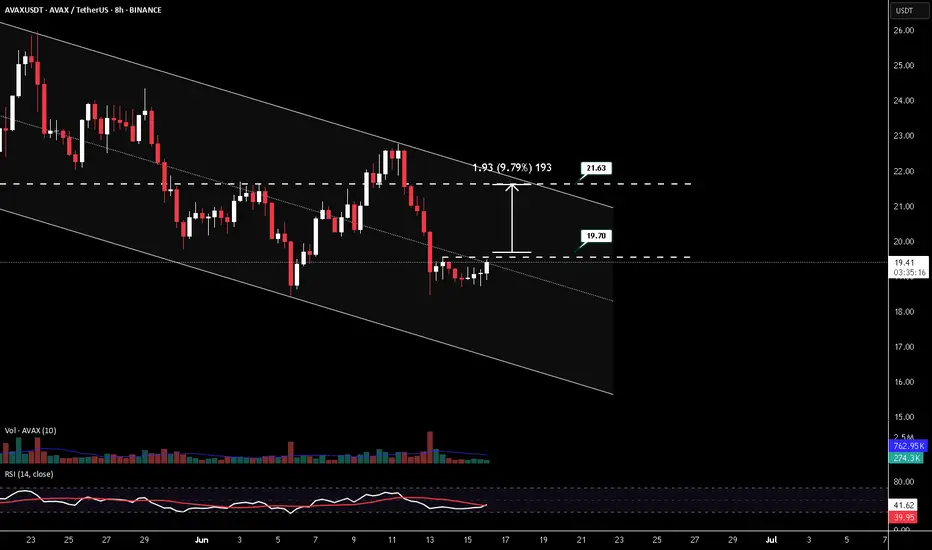
AVAXUSDT LONG POSITIONENTRY: 19.70
TAKE PROFİT : 21.63
STOP LOSS : 1/3
Do not use high leverage!
Remember cash management (planning)!
Please follow the stop-loss rule!
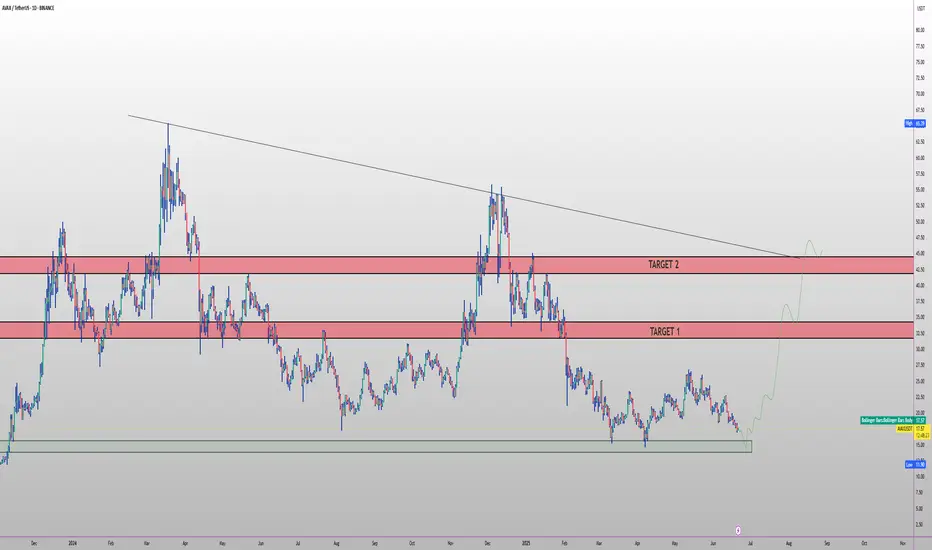
AVAX PLAN FOR 2025 H2 🔥 CRYPTOCAP:AVAX long setup (1D) 🚀
✅ Entry Zone: $14.50 – $16.50 (macro support)
🎯 Targets
• TP-1: $34.00 (’24 supply block)
• TP-2: $46.00 (descending-trend tap)
⛔ Stop-Loss
Daily close < $13.00
📊 Thesis
HyperSDK mainnet → 100 K+ TPS subnets ⚡
Durango Warp Messaging brings native cross-subnet calls 🔀
$50 M Vista fund kick-starts RWA tokenisation 💰
Evergreen subnets land Tier-1 institutions 🏦
Web3 gaming boom (Shrapnel, Off The Grid) 🎮
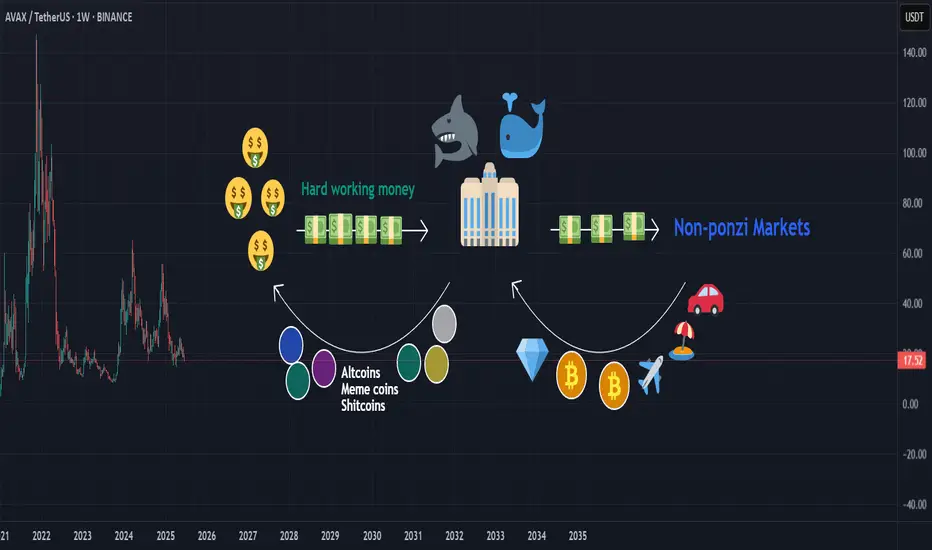
Crypto Jungle: Where Whales Feast and You’re the SnackHere’s the harsh truth: whales and market makers are robbing you blind. They create hype around garbage altcoins, meme coins, and straight-up shitcoins. You, the hardworking retail investor, buy the dream—they dump the bag.
While you're stuck holding worthless tokens, they’re off buying Bitcoin, gold, real estate, and flexing in Lambos on exotic beaches. It’s not investing—it’s a jungle. And you're the easy meal.
This isn’t a game. It’s a cycle: they pump, you buy, they dump, you cry. Stop being the prey. Start thinking like a predator—or get eaten.
BINANCE:BTCUSDT BINANCE:ETHUSDT BINANCE:ADAUSDT BINANCE:SUIUSDT BINANCE:SOLUSDT BINANCE:BNBUSDT
HolderStat┆AVAXUSD held the trend lineBINANCE:AVAXUSDT is rebounding from the 19 support after a falling-wedge break, flipping the pullback into bullish continuation. Holding the trend-line keeps Avalanche pressed north; clearing 22.8 unlocks 25 and fresh-highs narrative 📈

Avalance (AVAX): Re-Testing Neckline Zone | Possible Short?Avalanche coin is showing weakness near the neckline, which is where we have been aiming to see a quick upward liquidity hunt, but then we did not see it.
So our game gameplan has not changed a bit; we still want to see a bigger correction on the coin and we will keep this view as long as the price remains below the neckline zone and the zone between 100 & 200 EMA.
Swallow Academy

They want AVAX to look weak down here Everyone’s staring at the recent drop like it’s collapse. I see rotation into discount. AVAX is tagging the 0.786 retracement (17.27) — the same level that Smart Money builds into before it reclaims value.
Breakdown of the move:
The range top at 26.86 marked the premium; we’ve now delivered deep into the 0.786
No displacement through the previous swing low — yet
Structure remains intact if 14.66 holds — anything above that is deliberate discount rebalancing, not failure
This is where liquidity collects before decisions are made.
Execution lens:
Accumulation zone: 17.27–14.66
If bulls defend this pocket, 20.76 (0.5 fib) is the first draw, then 22.20
Final delivery window sits between 22.20–23.98 — where late buyers chase
AVAX doesn’t need a narrative. Price is the narrative.
Watch this base. And if it holds — don’t act surprised when it’s 20+.
For more setups that map where, not when — check the profile description.

AVAXUSDT 1W AnalysisAVAX ~ 1W Analysis
#AVAX Buy from here if you still have confidence in this coin with a short term target of at least 20%+, long term target $55

Avalanche, The Money Tree; Great Entry Price & TimingWhat's the first thing you consider when looking at a chart? What is the first thing that catches your attention?
When you take the leap, how confident do you feel that your conclusions are correction? Do you doubt yourself? I don't.
The first I look at are the candles and the chart structure. Later comes the volume and price patterns. Finally, if somehow the direction is not yet clear, I add some indicators for additional support. What about you, what is the first thing you consider when looking at a chart?
I think Avalanche is ready to grow based on a rising channel, a structure of a higher lows. This small and young structure is a period of consolidation before maximum growth. Timing is running out. The market is about to go bullish and it will grow with full force.
It doesn't matter what is happening "out there," Crypto is going up.
Looks like a great entry timing is possible on this chart. The price is awesome. It is the same chart setup we've been looking at for months and months. The current price range has been active since early March.
The rise from March, April and May all include the 3-February low. It is certain and highly obvious, this consolidation has been going for too long. The bearish bias is missing. Bullish consolidation means that a bullish breakout will follow when this phase ends. The start of a new uptrend. All those altcoins that moved first revealed what will happen to this pair.
Did you miss those? I showed you some pairs that grew more than 100% in a single day. You know something interesting? The chart on those pairs is exactly the same as this one. The drop, the recovery and the higher low.
Soon, very soon, Avalanche will follow and the rise will be very strong.
Namaste.
