AVAXUSDT IDEAUPDATE
Falling Wedge Breakout Has Already Confirmed Retesting In Process In case Of Successful Retest Expecting +40% Bullish Rally ✍️
COIN DETAILS
The live price of Avalanche is $ 34.03 per (AVAX / USD) with a current market cap of $ 12.49B USD. 24-hour trading volume is $ 448.47M USD. AVAX to USD price is updated in real-time. Avalanche is +4.5% in the last 24 hours with a circulating supply of 367.10M.
AVAXUSDT trade ideas

AVAX/USDT Ready for an Explosive Bull Run? 👀🚀AVAX Analysis 💎Paradisers, let's turn our gaze to #AVAXUSDT, as it's signaling a potential substantial move from a critical demand level.
💎#Avalanche is demonstrating an upward trend, indicating a likely bullish departure from its current demand zone. We're looking at a retest of the demand level at $27.13, with a significant supply zone on the horizon. If #AVAX maintains above this threshold, it may set the stage for an ascent toward the major supply zone at $47.6.
💎If #AVAX encounters difficulties in holding its ground above the support, a strategic reassessment may be necessary. In that case, we would consider initiating a bullish movement from a lower bullish Order Block (OB).
💎It's imperative to monitor this level closely, as a fall below could result in a considerable bearish trend.
💎Stay vigilant and ready to adapt, Paradisers. Your ParadiseTeam is committed to offering the latest insights and strategic guidance, ensuring you're primed to effectively manage these market changes.

AVAX Breaks Resistance. 6% Pump to weekly level Incoming.Local trendline has been broken. #Avalanche has also reclaimed the daily level.
The weekly level above is the target as long as we don't get rejected from the trendline above.
Calculate Your Risk/Reward so you don't lose more than 1% of your account per trade.
Every day the charts provide new information. You have to adjust or get REKT.
Love it or hate it, hit that thumbs up and share your thoughts below!
This is not financial advice. This is for educational purposes only.

Avax technical Analysis#AVAX Technical Analysis
CRYPTOCAP:AVAX might stay sideways between the marked support and resistance.
if it breaks down it will trade in the area filled with red highlighter, because it has no any strong trading zone in this range,

AVAXUSDT is BearishAVAXUSDT is experiencing strong bearish momentum and is consistently printing lower highs and lower lows, which according to Dow theory is the classic definition of declining phase. After a small bullish correction, bearish RSI divergence has appeared on 4H time frame, and hence this means that further downside is expected for AVAX. Targets are mentioned on the chart.

AVAX SpeculationAvax has been trading in the descending range
Why I think there will be more downwards price action before we see a higher rally up.
- Key resistance in the descending range
- Key support/resistance area
- Next support aligns with the bull market support band
Tight stop loss has been placed since we never know with these markets.

Still early for AVAXGood HTF setup on AVAX. It'll run at some point. Not sure about ATH. But 60s looks good enough for me.

#AVAX/USDT breaks the Diagonal Trendline and PDL support level t#AVAX/USDT breaks the Diagonal Trendline and PDL support level too in 1-Hour TF!
Wait for retest to short $AVAX. I am waiting for retest. The target can be $28.

Avalanche AvaxWhat is Avalanche?
Avalanche is the fastest smart contracts platform in the blockchain industry, as measured by time-to-finality. Avalanche is blazingly fast, low cost, and eco-friendly. Any smart contract-enabled application can outperform its competition by deploying on Avalanche.
Avalanche launched on mainnet, September 21, 2020. Since then, the platform has grown to secure over 400+ individual projects, $64M+ of AVAX burned (reducing supply), 1,200+ individual block-producing validators, and over 1.3M+ community members around the globe.
- Strong Project, " TP Numbers " are very simple.
- i didnt include Fibo calculations to keep the chart clean but i've done it
-----------------------------------------------
Trading Plan
-----------------------------------------------
Buy : Now
Rebuy : 50$ Zone is a gift
-----------------------------------------------
TP1 : 150$ (ATH Security TP)
TP2 : 200$
TP3 : 300$
SL : 40$ if you want to set it
-----------------------------------------------
Happy Tr4Ding!

AVAXUSDTBuy at green line and take your profit at target 1 10% profit make your stop loss candle closed under red line 1 hr
Good luck !

AVAX Lights the Path: Get In on the Buy Action Today!**Avalanche (AVAX)**
**Fundamentals**
Avalanche is a decentralized blockchain platform that supports smart contracts and decentralized applications (dApps). It is one of the fastest and most scalable blockchains in existence, with an average transaction confirmation time of less than one second. Avalanche is also energy-efficient, consuming less than 46 US households of electricity per year.
**Recent News**
* **Avalanche Emerges as Ethereum's Potential Challenger** (Cointelegraph, January 28, 2024)
* **Avalanche Team Takes Aim at Memecoin Staking** (Investing.com, January 26, 2024)
* **Bitcoin 38K Yaklaşırken Solana ve Avalanche Tokenları Keskin Düşüş Yaşıyor** (CoinOtag, January 23, 2024)
* **Solana (SOL) ve Avalanche (AVAX) Neden Düşüyor? Güncel Grafik Yorum ve Fiyat Tahminleri** (CoinTurk, January 18, 2024)
**Disclaimer**
Please note that this is not financial advice. The cryptocurrency market is volatile and risky, and you could lose money investing in any cryptocurrency. Do your own research before making any investment decisions.


pivot + daily: jan 29, 2023day pivot + OTE ZONE
long
im kinda sleepy so i dont have the words right now.
it's just that the market just ticked towards the upside and i'll probably lose the short entry i had last time,
but hopefully not before allowing me to pick the market here first on this pullback(possible)

AVAXUSDTAVAXUSDT is trading in descending channel and printing consistent LLs LHs. Recently the price is broken the important support zone and now retesting the broken level, which is also the 50% Fib retracement level.
If the sell momentum continues the next target could be 25
What you guys think of this idea?

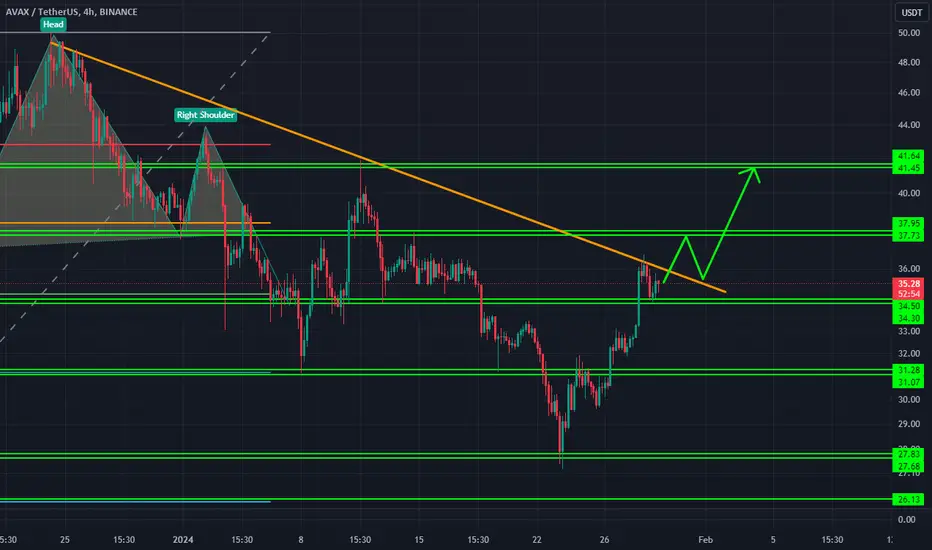
#AVAXUSDT#AVAXUSDT 4H
The price of Avax at this moment is 35.3 dollars, and according to breaking the resistance of 31.28 dollars and then 34.5 dollars, and with the gathering of the price spring attached to the yellow trend line, the price is expected to move in one direction with Sharpie movement. In case of breaking the price trend line 37.95 is not far from mind.
Technical analyst: Amir Hassan Salek
$AVAX #AVAX Time for some Weekend Scalps downside should be limited,
shouldnt get anything major over the low volume weekends, alts could get nice rallies. 0.236 - 0.382 are GREAT areas to bank some profits (ideally wanna derisk or close by premarket on Monday), or let it run. a 5 wave move down was completed, clearly visible. In the bearish scenario, can retrace to 0.786 as a wave B, in the bullish case well thats self-explanatory so take profits as you like, just before resistance levels are most common
Risk:Reward LFG!!

🔥 AVAX Huge Bull-Flag Breaking OutAlthough I've been generally bearish on Bitcoin after the ETF, I have to play with the cards that the market dealer gives me.
For AVAX, that means that this token is under way of breaking out of a big bull-flag pattern that has been shaping up since halfway December.
In case the 3D candle closes above the top resistance, it could very well indicate that further strength is coming to this token. Looking for a 105$ target over the next few months.

I Think the General Principles Work
These are the principles I have gained due to the reading materials.
1. Wait for Extreme Premium/Discount
2. Wait for Price to Exhaust Pressure
3. Wait for Any Chart Patterns Indicating Reversal
4. Wait for Trendline Break with Momentum
5. Wait for HARSI/WAE Above Explosion Line + Reversal Engulfing Candle Close
6. Entry on Trendline or Pivot Re-Test.
NO DISCOUNT/PREMIUM, NO PRESSURE, NO RE-TEST, NO ENTRY.

Avax breaking resistanceAvax and alts are breaking resistance to the upside, the stronger narratives are showing themselves. I expect 45$ here unless btc dead cats sooner than I thought.

AVAX If you find this information inspiring/helpful, please consider a boost and follow! Any questions or comments, please leave a comment! Also, check out the links in my signature to get to know me better!
CRYPTOCAP:AVAX update 🧵
Nice bounce out of identified AOI.
Want to see a nice completed impulse up here with a break and flip of this level.
37.51
Break back below
33.42 from here is sus.
Cheers

Avalanche(AVAX): Amazing Short Opportunity For Sure! The coin has great potential for some downward movement here, for sure, with price reaching the major resistance zone, which we will not be able to breakout from with our first attempt. As now we have started the rejection phase, we might see even further movement here for sure to lower support!
The first sign of potential reversal is RSI entering back in normal zones (after being in overbought zone)
Swallow Team

AVAX 1D BREAKOUTAVAX has closed it's 4HR candle above the Kijun or the dotted red line. Volume looks promising and if it stays above once the 1D candle closes, we good to go crypto bros.
