Avalanche Will Grow, You Can Count On It! (460% PP)After a bullish breakout, there is always a retrace. A retrace can be short or long but never deep. If the retrace goes too deep it turns into a correction.
Notice here AVAXUSDT after the 7-April low, it starts to grow. There were two red sessions, total of 4 days (2D candles) followed by additional growth. We have a red session now which is the current active session. AVAXUSDT can continue growing right away or produce a few of these red sessions before additional growth.
The market never moves in a straight line, up or down, it always fluctuates and these fluctuations can seen like a big deal when we are looking up-close. If we zoom-out and consider the bigger picture, we soon realize it is all noise.
After the bottom is in, we get growth. Not only that, always higher highs and higher lows. So AVAXUSDT will continue growing long-term regardless of the short-term. Never worry about what happens today, tomorrow or in a single day. By the end of the week, it turns green; at the end of the month, prices are up. It is only the start, Avalanche is going higher for sure.
Just a friendly update and reminder to let you know that you can sleep easy, there is nothing that can stop this event we've been waiting for. It works like the Sun, it comes out everyday, you can count on it. Crypto goes down and then goes up, you can count on it...
Avalanche will grow!
Namaste.
AVAXUSDT trade ideas


AVAX Analysis: Building Up for a Potential Breakout🔹 Since mid-December, AVAX dropped hard, losing more than 70% from the highs.
🔹 Recently, the coin found strong support around the $15 zone, testing it twice — possibly forming a double bottom pattern.
🔹 At the time of writing, price is consolidating right under the neckline and seems to be building momentum for a move.
Key technical points:
• Massive drop from $55 opens room for a stronger relief rally.
• A breakout above the $23 resistance would confirm bullish continuation.
• $18 is now the new support zone — as long as it holds, the bias remains bullish.
• Major target for bulls: $30–31 area.
🚀 Plan: Watching for a confirmed breakout above $23 for potential continuation higher. As long as $18 support holds, dips could be seen as opportunities.


#AVAX/USDT#AVAX
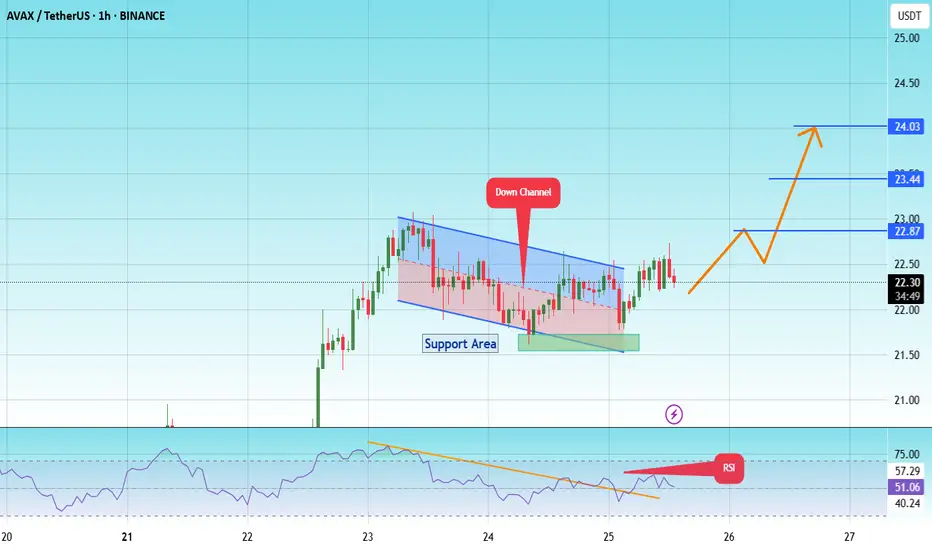
The price is moving within a descending channel on the 1-hour frame and is expected to break and continue upward.
We have a trend to stabilize above the 100 moving average once again.
We have a downtrend on the RSI indicator that supports the upward move with a breakout.
We have a support area at the lower boundary of the channel at 21.50, which acts as strong support from which the price can rebound.
Entry price: 22.28
First target: 22.87
Second target: 23.44
Third target: 24.00


Lingrid | AVAXUSDT Bullish TREND with KEY Support ZoneBINANCE:AVAXUSDT market is making higher highs, demonstrating a clear bullish trend on the current timeframe. The price has reached the previous resistance zone where it formed a pullback. This time, the price may pull back again toward the psychological level at 20.00. I expect the price to find support and bounce at the confluence of three technical factors: the support level, the previous week's high, and the upward trendline. This triple support zone could provide a solid foundation for continuation of the bullish move. My goal is resistance zone around 23.50
Traders, if you liked this idea or if you have your own opinion about it, write in the comments. I will be glad 👩💻

AVAX has officially flipped its market structureAVAX has officially flipped its market structure after breaking through dynamic SR resistance that had capped price since February. A strong move from a swing failure pattern at the lows has led to a decisive reclaim of the value area high and point of control.
Key Points:
Price has confirmed a breakout above dynamic SR resistance, now acting as support.
A higher high has been established — a higher low above this region would validate a full bullish market structure shift.
If AVAX can hold this support and print a clear higher low, it opens the door for a continuation move toward the $28.70 swing high. However, failure to hold could lead to a retest of lower levels. As it stands, structure and momentum favor bulls.
AVAX breaks key resistance with strong momentum, signaling a potential bullish reversal. A confirmed higher low could open the path to a rally toward $28.70.


Avalanche Bullish Confirmed (1,425% Easy Profits With 5X Lev.)Some trade setups are hard, risky, while others are very easy. This one is really easy with relatively low risk.
How are you doing in this wonderful day my fellow Cryptocurrency trader?
» Avalanche is now confirmed green.
While we looked at a pair recently, DOGEUSDT, where trading volume isn't present but the chart signals are still pointing up, here we have a pair that has very strong volume to mark the most recent correction bottom low.
Also, while DOGEUSDT produced a higher low in April 2025 vs August 2024, here Avalanche (AVAXUSDT) produced a lower low. This lower low is good for buyers, it means the bears went beyond 100% and when this happens, there is nothing more to sell, this increases the chances of the next move being strong when it develops. The high buy volume on the drop confirms this statement. This will be a strong bullish wave.
Avalanche is set to grow very strong in the coming months, what I am showing you here is an easy target, very strong potential, mid- to short-term. This can all develop within 1-3 months. So this is perfect. A great opportunity to grow your bank and go beyond any losses the correction produced.
Such strong high volume at "critical level" support indicates that buyers were waiting, ready and present. Now that the low is in, the market reverses from red to green.
» The first target is an easy 90% for spot traders, but leverage traders can extract as much as 450% with just 5X.
» The second and main target, which is also easy because total growth for this newly development bullish cycle will be much higher than what is shown on the chart, goes to $81 for 285%. When we add the reasonable 5X, that's a nice 1,425%. That's it. Timing is of the essence.
The market is good now. The chart looks good now. Once the next bullish wave starts, there is no going back, low prices will be gone forever and the market will be rising until the end of 2025.
Thanks a lot for your continued support, I hope you enjoyed the chart.
Namaste.

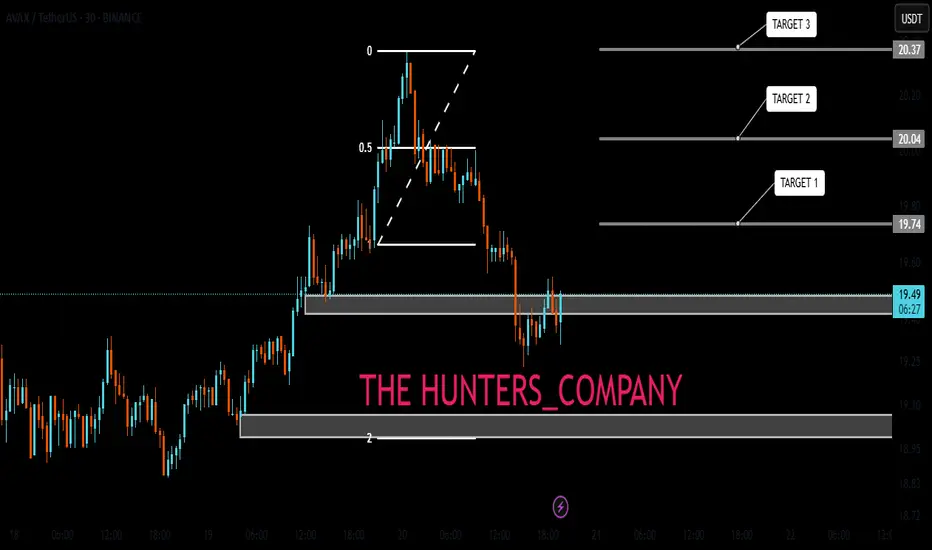
AVAX Jumping the Creek My previous two "bear flag" ideas were invalidated. This is a Jump the Creek situation. Shown here is a zoom in to the 30 minute time frame of the part that I thought was a bear flag.
Bellow is some info in layman's terms of the Wyckoff Reaccuumulation Trading phases also known as "Jump Across the Creek"
----------------------- Please Hit the Rocket if You Like This......------------------
Think of a market like a tug-of-war between buyers and sellers. Sometimes, after a big uptrend, the market takes a "break" to recharge before heading higher again. This “resting” period is called reaccumulation — it's like a pit stop in a race.
Imagine price action moving through a messy sideways area — picture a creek with lots of rocks and water making it hard to cross.
In this phase, the market has been struggling to get above a certain price zone (the "creek") — there are little rallies and dips, but no clear breakout.
Then, suddenly, the price "jumps across" this resistance zone with a strong move upward — like a bold leap across the creek.
This jump typically: ✅ Comes with strong volume (showing conviction from big buyers)
✅ Breaks above the previous highs in the consolidation zone
✅ Signals the beginning of a real uptrend — the reaccumulation is ending, and the next bullish phase is beginning
🧠 Think of it Like This:
The market’s been jogging in place, building strength.
“The creek” = a resistance zone keeping price trapped.
“Jump Across the Creek” = price finally gathering strength to leap out of the mud and start sprinting again.
📈 Traders Look for:
A breakout with higher volume
Pullbacks that don’t break down — these often retest the “creek” area before moving higher

#AVAXUSDT 1WThe price has faced an increase in demand within an appropriate time and price range, forming favorable reversal candles. If the $22 level is broken, the growth trigger will officially activate, and one could be optimistic about the price reaching the upper boundary of the descending channel, around the $47 range, in the medium term.


Avalanche Potential UpsidesHey Traders, in today's trading session we are monitoring Avalanche for a buying opportunity around 19.20 zone, Avalanche is trading in an uptrend and currently is in a correction phase in which it is approaching the trend at 19.20 support and resistance area.
Trade safe, Joe.


Reversal Pattern in Play – Will AVAX Flip Bullish?CRYPTOCAP:AVAX is showing signs of a potential reversal after forming a double bottom near the $17 zone. It’s currently testing a key resistance trendline along with a minor horizontal resistance around $19.50–$20.50.
A successful breakout and close above this zone could trigger bullish momentum toward $22+. However, rejection here may lead to another dip back toward support.
Price action is tightening, so a decisive move is likely soon.
DYOR, NFA


AVAX printing BEAR Flag on 4 hourMany times I have seen a failed H&S pattern play out days later. It appears that a bear flag is forming and that the failed plunge will take place soon. Shown here is the 4 hour chart, showing a recent double top. If the price of AVAX holds above $19.20 than this theory will be invalid.

AVAXUSDT – %180 VOLUME SPIKE! Major Resistance Ahead 📊 What’s Happening?
✅ Volume is exploding (+180%) – This means big money is moving, but in which direction?
✅ Blue Box = A HUGE Resistance Zone – This is where sellers may step in aggressively.
✅ Breakout vs. Rejection? – We’re at a critical decision point.
💡 How I’m Trading This:
📌 Scenario 1: Rejection – If price stalls at the blue box, I’ll watch for LTF breakdowns + CDV confirmation for a high-R short.
📌 Scenario 2: Breakout & Retest – If price pushes above with strong volume, I’ll wait for a clean retest before considering a long.
🔑 Pro Trading Mindset:
I don’t marry my bias. If price shifts structure, I shift with it. No guessing. No hoping. Just data-driven execution.
Follow me for real-time, high-probability trade setups. Smart traders adapt, amateurs gamble.🔥
✅I keep my charts clean and simple because I believe clarity leads to better decisions.
✅My approach is built on years of experience and a solid track record. I don’t claim to know it all but I’m confident in my ability to spot high-probability setups.
✅If you would like to learn how to use the heatmap, cumulative volume delta and volume footprint techniques that I use below to determine very accurate demand regions, you can send me a private message. I help anyone who wants it completely free of charge.
🔑I have a long list of my proven technique below:
🎯 ZENUSDT.P: Patience & Profitability | %230 Reaction from the Sniper Entry
🐶 DOGEUSDT.P: Next Move
🎨 RENDERUSDT.P: Opportunity of the Month
💎 ETHUSDT.P: Where to Retrace
🟢 BNBUSDT.P: Potential Surge
📊 BTC Dominance: Reaction Zone
🌊 WAVESUSDT.P: Demand Zone Potential
🟣 UNIUSDT.P: Long-Term Trade
🔵 XRPUSDT.P: Entry Zones
🔗 LINKUSDT.P: Follow The River
📈 BTCUSDT.P: Two Key Demand Zones
🟩 POLUSDT: Bullish Momentum
🌟 PENDLEUSDT.P: Where Opportunity Meets Precision
🔥 BTCUSDT.P: Liquidation of Highly Leveraged Longs
🌊 SOLUSDT.P: SOL's Dip - Your Opportunity
🐸 1000PEPEUSDT.P: Prime Bounce Zone Unlocked
🚀 ETHUSDT.P: Set to Explode - Don't Miss This Game Changer
🤖 IQUSDT: Smart Plan
⚡️ PONDUSDT: A Trade Not Taken Is Better Than a Losing One
💼 STMXUSDT: 2 Buying Areas
🐢 TURBOUSDT: Buy Zones and Buyer Presence
🌍 ICPUSDT.P: Massive Upside Potential | Check the Trade Update For Seeing Results
🟠 IDEXUSDT: Spot Buy Area | %26 Profit if You Trade with MSB
📌 USUALUSDT: Buyers Are Active + %70 Profit in Total
🌟 FORTHUSDT: Sniper Entry +%26 Reaction
🐳 QKCUSDT: Sniper Entry +%57 Reaction
📊 BTC.D: Retest of Key Area Highly Likely
📊 XNOUSDT %80 Reaction with a Simple Blue Box!
I stopped adding to the list because it's kinda tiring to add 5-10 charts in every move but you can check my profile and see that it goes on..
