$AVAX LONG/SPOT CRYPTOCAP:AVAX 1D - SPOT/PERP.
Price formation keeps upward vector.
The designated zone of interest (POI 1W) may provide favorable conditions for forming long/spot positions.
Targets: $21.03, $23.46, $25.12, $26.54, $28.78
AVAXUSDT trade ideas

AVAX/USDT:BUYHello friends
Given the good price growth, we see that the price has not managed to reach a higher ceiling and has fallen, so we can buy in stages during the price decline within the specified ranges and move with it to the specified targets.
Observe capital and risk management.
*Trade safely with us*

Avalanche (AVAX): Weakness Near Major Support ZoneWe are seeing weakness near major support, which might result in a nasty fall of 30%. We are waiting for more confimations here but if all plays out nicely, then a good R:R trade can be taken here.
Swallow Team

AVAXUSDT Ready to Explode? Avalanche ( BINANCE:AVAXUSDT ) has successfully retested its previous support zone, showing strong signs of a potential upward move. This retest confirms the level as a solid base, and the price action is hinting at a shift in momentum. Currently undervalued and flying under the radar, Entering the trade at this level offers a favorable risk-reward ratio, with the previous swing low acting as a logical stop-loss point. Once the market gains momentum, we could see explosive moves from $AVAX. As always, manage your risk wisely and never trade without a stop-loss. This could be the calm before the storm — don’t miss out on the next big wave!
BINANCE:AVAXUSDT Currently trading at $19
Buy level : Above $18.7
Stop loss : Below $17.5
Target : $25
Max leverage 3x
Always keep stop loss
Follow Our Tradingview Account for More Technical Analysis Updates, | Like, Share and Comment Your thoughts

$AVAX/USDT READY TO MOVE?? | Inverted H&S.Chart Analysis 📊
BINANCE:AVAXUSDT.P
The chart shows an Inverted Head and Shoulders pattern with a clear Left Shoulder, Head, and Right Shoulder. ✅
This is a bullish reversal pattern, and the price is near the neckline (green line).
A breakout above this level signals a potential upward move.
Trade Setup 🛠️
Entry Zone: CMP - 18.574 🟢
DCA: If price dips, buy more around 18.227 to average your entry and reduce risk. ⚖️
SL: 17.559 / 4h cc below
Targets:
🎯 White lines
🎯 24.000 (final swing trade target!)
Risk Management ⚠️
Risk only what you can afford to lose.
This is a high risk and reward setup.
Don't forget to hit the 🚀 boostel button of you like the setup.
Thanks

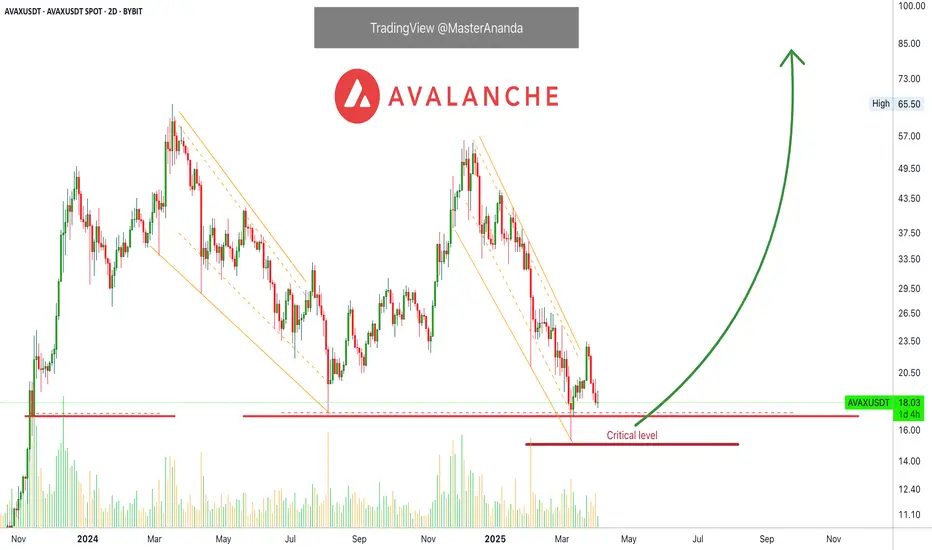
Avalanche Update: Easy 510% Profits TargetThis is a perfect chart setup. Price dynamics are revealing a strong potential for the development of a major bullish wave; let me explain.
There was a low around 10-March, followed by a small bounce. This small bounce I take as an early reversal signal but being early caution is advised. Then we have another support in the critical zone.
The initial bounce produced a lower low but there was strong buying right at the "critical level," this signal is strong. The low session ended as a Doji and is immediately confirmed by two days of green. Volume is high on the buy. Prices are now up.
Touch and go. There was a drop below support but the action recovered right away. A failed signal for the bears, a bullish reversal is in place.
Seeing marketwide action, Bitcoin and everything we already know, Avalanche is preparing for a nice up-thrust. This can be big, many times bigger than anything we've seen in several years. We are going up.
An easy target is mapped on the chart, it goes beyond 300%. 500%+ can be achieved within months. So much more by the time this year ends. It will be great.
Thank you for reading and for your continued support.
Early is best. Keep it simple.
Namaste.

AVAX Triple Bottom or Crazy Cup and Handle?I think most traders will view this as an invalidated cup & handle, but you could consider the current state of affairs as a triple bottom. I think the handle dipped down too much due to the USA tarrif turmoil, but that does not mean the cup was not formed.
This idea is invalid if we dip below $14.50, in that case, AVAX could go down to the mid $8.00 range.
However, with the bullish news of VanEck and Nasdaq about to launch an AVAX ETF... my prediction is that we will see $23 very soon.
-Best Wishes
NFA

AVAX Set for a 90% Takeoff — Catch It Before the Lift-Off! (1D)AVAX has reached the weekly support zone.
The structure is still bearish, but there is an expectation that enough buy orders exist in this area to create a bullish substructure.
One resistance base ahead of the price has already been consumed, and above that base, there is a liquidity pool that may get swept.
Targets are marked on the chart.
A daily candle close below the invalidation level will invalidate this analysis.
invalidation level : 11.09$
Do not enter the position without capital management and stop setting
Comment if you have any questions
thank you

Avalanche is trying to bottom out here. Watch list material. AVAX is holding nicely with the double bottom. However, a CHOCH is needed to have a better confirmation of a reversal. Momentum and trend oscillators are diverging bullishly however without market structure be careful with risk.
Full TA: Link in the BIO

AVAXUSDT - Setting Up For A Move higher...After decoding what I believe is the most accurate interpretation of the larger Bitcoin pattern—and how it mirrors across Altcoins—I can now break down what this means for Avalanche. A setup is forming for Wave (C) of Wave D, and it’s looking promising.
Once Wave (B) wraps up, I’ll be closely tracking and trading this expected move higher. Stay tuned.

Long AVAXPrice cleared out disruption zone and is looking to take out structural liquidity above
Following the orderflow , upside movements are expected for now till proven otherwise

TradeCityPro | AVAXUSDT Watch the Altcoins!👋 Welcome to TradeCityPro Channel!
Let’s dive into the analysis of one of my favorite coins, which is likely to make a move this week. Let’s break it down and take a closer look together!
🌐 Overview Bitcoin
Before starting the analysis, I want to remind you again that we moved the Bitcoin analysis section from the analysis section to a separate analysis at your request, so that we can discuss the status of Bitcoin in more detail every day and analyze its charts and dominances together.
This is the general analysis of Bitcoin dominance, which we promised you in the analysis to analyze separately and analyze it for you in longer time frames.
📊 Weekly Timeframe
On the weekly timeframe, the AVAX chart is one of the smoothest and most technical charts I’ve seen—support and resistance levels work like a charm, and price patterns are fairly predictable.
After getting rejected at the key resistance of 53.62—a historically significant level—sellers stepped in, pushing us into a deep correction. The failure to break this level was partly because we didn’t enter overbought territory on the weekly chart.
For buying, the weekly chart is currently very bearish, so jumping in now isn’t logical. However, a break above 53.82 would be our most reliable trigger for an upward move. For exiting, if we drop below 21.02, I’d personally cash out. If we climb back above 21.02, I’d buy again—this time with fewer AVAX but the same USDT amount to manage risk.
📉 Daily Timeframe
In the daily timeframe, after a rejection at 53.96 that led to a correction, it seemed likely we’d test this resistance again. However, after the rejection, we broke below 44.21, forming a price range box.
Right now, we’re not paying much attention to resistance levels. Our trendline is showing lower highs but flat lows, indicating that our movement is driven by the trendline rather than traditional support and resistance.
With that in mind, a break of the trendline could spark a move, but we still need a trigger. The 22.71 level is our breakout trigger—not just a resistance. If we break it, we could enter a buy with a risky stop loss at 16.00. Confirmation would come from a spike in volume. For selling, if we get rejected at the trendline and break below 16.00, I’d personally exit.
✍️ Final Thoughts
Stay level-headed, trade with precision, and let’s capitalize on the market’s top opportunities!
This is our analysis, not financial advice—always do your own research.
What do you think? Share your ideas below and pass this along to friends! ❤️

Trading opportunity for AVAXUSDTBased on technical factors there is a Sell position in :
📊 AVAXUSDT
🔴 Sell Now
🪫Stop loss 22.50
🔋Target 14.50
📏 R/R 2
💸RISK : 1%
We hope it is profitable for you ❤️
Please support our activity with your likes👍 and comments📝

Avax usdtAvax just completed a full sha pattern and could witness a potential short rice in price from it's current price

AVAX Is Ready For Big Storm !!!Avax forming a big symmetrical triangle on weekly time frame & currently is sitting on big symmetrical support...
Although currently is in macro 2nd wave which seems to be end...
Soon we may see big moves in Avax storming straight out of triangle, targeting first at 104$ and 2nd around 500$ which aligns which triangle target along with macro 5th wave...


AVAX🔺Lets GoThe long-term downtrend has been broken and the pullback has been completed, ready to climb?!

Trading opportunity for AVAXUSDTBased on technical factors there is a Sell position in :
📊 AVAXUSDT
🔴 Sell Now
🪫Stop loss 18.10
🔋Target 13.50
📏 R/R 2
💸RISK : 1%
We hope it is profitable for you ❤️
Please support our activity with your likes👍 and comments📝

EASY Trading AI Prediction: Short Opportunity on AVAXUSDTBased on the EASY Trading AI analytical strategy, I'm eyeing a sell signal on AVAXUSDT. Currently, the market indicates notable selling pressure entering at 17.87, putting the short-term target at a Take Profit of 17.58333333, with a protective Stop Loss activated at 18.26333333.Our proprietary algorithm detected overbought momentum and weakening bullish volume at this key price level, signaling a likely downward correction. Strictly follow these parameters to manage your risk effectively.Trade precisely, control risks, and stay profitable.

Possible Scenario for AVAX/USDTPossible Scenario for AVAX/USDT:
1. Price Action: The price is within a descending channel marked by the blue lines. This suggests a bearish trend as the price has been making lower highs and lower lows.
2. Potential Scenarios:
- The **green arrow** indicates a potential bullish scenario, where the price might break out to the upside, aiming toward a target of around $31.84.
- The **red arrow** suggests a bearish scenario, where the price might break down further, potentially testing the lower support level near $11.91.
3. Key Levels:
- **Resistance**: Around the $31.84 level (shown in red), which could be a strong resistance zone if the price attempts a recovery.
- **Support**: Near the $11.91 level (shown in green), which could act as strong support if the downtrend continues.

Avalanche's Higher Low Indicates The Bottom Is InAVAX is currently trading above its August 2024 bottom low price, and this is bullish.
AVAXUSDT produced a major low on the 10-March trading session. The current session is a higher low compared to this date. This is a double bullish signal. The August low and last month. Both are active, valid and hold.
So the August 2024 low was actually tested and pierced but the session close happened above this level. The bottom back then was $17.27. In March, AVAXUSDT went as low as $15.30 but closed at $17.51. The next session went below again and hit $16.95 but closed at $18.5. As you can see, the bulls win.
The current session is green after four sessions closing red. Each session has two candles, 48 hours (2D candles).
Here we have the activation of long-term support. Classic behaviour before a major bullish run.
The dynamic is always this: The correction unravels and gains momentum before reaching its end. When it hits bottom, there is a strong reaction causing a sudden bullish jump. This bullish jump is short-lived and quickly corrected. This short-term correction ends in a higher low. From this higher low, prices start a new wave of growth. We are entering this new growing phase now.
Thanks a lot for your continued support.
This is another time based chart.
The time to enter is now, always focusing on the long-term.
We buy now with the patience and mindset to hold between 6-8 months. If this can be done, easy and big wins will be yours.
The 2025 All-Time High potential and more can be found by visiting my profile.
Thanks a lot for the follow. Your support is appreciated.
Namaste.
AVAX DAILY ANALYSISHi friends,
Let's get back into analysis after Eid al-Fitr vacations.
Today, we pay attention to AVAX in the Daily time frame.
As marked on the chart, we have a strong daily resistance trend line and a 4-Hour resistance trend line, which is marked by yellow color. As you can see that we had a great support level of $19.855, which has now turned into resistance.
Also, you can see that for AVAX to retain its bullish momentum, it has to close daily candles above $29. Besides that, we have a strong daily and weekly accumulation area between $12 and $15.
We have a local 4-Hour support level that is ideal for entering into short positions after having the momentum and confirmations.

#AVAXUSDT: Three Swing Buy Take Profit EntriesThe cryptocurrency market has experienced volatility in recent months, particularly with the #AVAXUSDT token. We have identified two potential price reversal points:
1. **Current Price Range:** The market is currently experiencing a surge in volume, indicating a potential reversal.
2. **Liquidity Removal and Reversal:** If the price were to remove liquidity and subsequently reverse at its previous low, it could trigger a significant price drop.
Additionally, we recommend setting three targets based on your analysis to guide your trading decisions.
We extend our sincere gratitude for your unwavering support since the beginning. We anticipate that this support will continue to grow and evolve.
Team Setupsfx_
🚀❤️
