AAVE Ready For New Highs?AAVE is breaking out of its descending trendline after several tests as resistance.
Wave 2 appears complete at quadruple support: Daily 200EMA, daily pivot, .382 Fibonacci retracement and High Volume Node (HVN). If an Elliot Wave (3) of 3 is underway, price should move strongly sooner rather than later with extended price action.
The next major resistance and partial take profit is at the December swing high range $460.
Analysis is invalidated below $210.
Safe trading
AVEUSD trade ideas

AAVEUSDTCryptocurrency Futures Market Disclaimer 🚨🚨🚨
Trading cryptocurrency futures involves high risks and is not suitable for all investors.
Cryptocurrency prices are highly volatile, which can lead to significant gains or losses in a short period.
Before engaging in crypto futures trading, consider your risk tolerance, experience, and financial situation.
Risk of Loss: You may lose more than your initial capital due to the leveraged nature of futures. You are fully responsible for any losses incurred.
Market Volatility: Crypto prices can fluctuate significantly due to factors such as market sentiment, regulations, or unforeseen events.
Leverage Risk: The use of leverage can amplify profits but also increases the risk of total loss.
Regulatory Uncertainty: Regulations related to cryptocurrencies vary by jurisdiction and may change, affecting the value or legality of trading.
Technical Risks: Platform disruptions, hacking, or technical issues may result in losses.
This information is not financial, investment, or trading advice. Consult a professional financial advisor before making decisions. We are not liable for any losses or damages arising from cryptocurrency futures trading.
Note: Ensure compliance with local regulations regarding cryptocurrency trading in your region.
thanks for like and follow @ydnldn

AAVE Standing out among the alt coins!CRYPTOCAP:AAVE is looking stronger than most for now. Local analysis has broken the bullish market structure on what appears to be a textbook Elliot Wave 1.
Price is testing quadruple support: Daily 200EMA, daily pivot, major support High Volume Node (HVN) and the 0.382-0.5 Fib retracements. This should be a tough nut to crack (as long as CRYPTOCAP:BTC doesn't dump hard).
Wave 2 retracement's are usually deep and come with a strong fear. It is where most retail investors capitulate only to find price turns around and continues bullishly without them in a aggressive wave 3.
Analysis is invalidated below $111, so quite a ways off yet.
If war escalation continue, irrational investor behaviour will likely break this technical analysis.
Safe trading.

$AAVE Going Through a Major Bullish Trend Shift!CRYPTOCAP:AAVE continues to outperform on pumps and retracements this cycle after being beaten down for many years!
Price consolidated below the weekly pivot and found support, only retracing to the .618 Fibs.
Wave 3 of iii pf a new Elliot Motif Wave looks well underway with the next price target being the R1 weekly pivot High Volume Node at $448.
Long term outlooks is very bullish for AAVE with a terminal target of the R5 weekly pivot £1155
Safe trading

AAVE is cookedBINANCE:AAVEUSD AAVE is moving along nicely through its cycle and events. Rhyming very well with Wyckoff Distribution schematic.
Since it's buying climax it has dipped to print an AR (Automatic Rally) and is now printing in a ST (Secondary Test) zone.
A shooting star through the 0.786 printed earlier this month; a major clue that this area is exhausted and may be ready for a retracement to the down side. Currently there is a SRP (Shake-out Reversal Pattern) printing before making it's next HTF move.
A "come-back" can be expected with this asset to later print a UT/UTAD (slightly higher high); considering its strength.
The lower demand line may prove to be adequate support. Or, even perhaps the 1:0.618 window.

Scaling back into $AAVE – 3x Leverage Setup📍Entry zone: $250 → $240 (scaled)
📍Support confluence:
• Daily Supertrend touch
• Rising trendline support
• Major horizontal level near $240
🛑 Stop Loss:
• 5% price move (→ $232.75 avg) = 15% capital loss at 3x
• Or Daily Supertrend flip (closes in ~9 hours)
🎯 TP1: $295 (trim 33%)
🎯 TP2: $372 (full exit)
⚖️ R/R Ratio: 8.29
• ✅ Reward: +124%
• ❌ Risk: -15%
Just booked +133% on the last one. Back in—structure’s still bullish until it’s not.
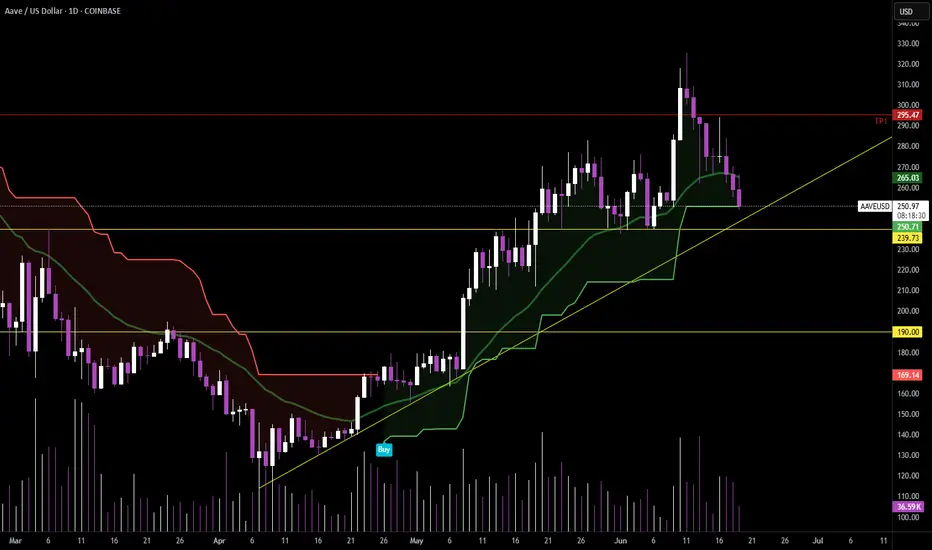
AAVEUSD 1D ChartHello everyone, I invite you to review the current situation of AAVE in the USD pair. When we enter the one-day interval, we can see how the AAVE price will see a return above the main upward trend line, but here we can see that we are still below the formed downward trend line, which in the event of further increases may prove to be a strong resistance.
Here we can see how the current rebound is fighting the resistance at $ 256, only when the level is positively tested, resistance will be still visible at the price of $ 290, this will be a strong resistance right next to the downward trend line, only a positive exit from the top and staying above this trend line can lead to movement towards resistance at $ 339.
Looking the other way, we can see that when the trend reverses, we first have a support zone from $ 233 to $ 211, however, if this zone is broken, we can see a quick return of the price to the support area at $ 174.
The Stoch RSI indicator shows that despite the current upward movement, there is still room for the upward movement to continue.

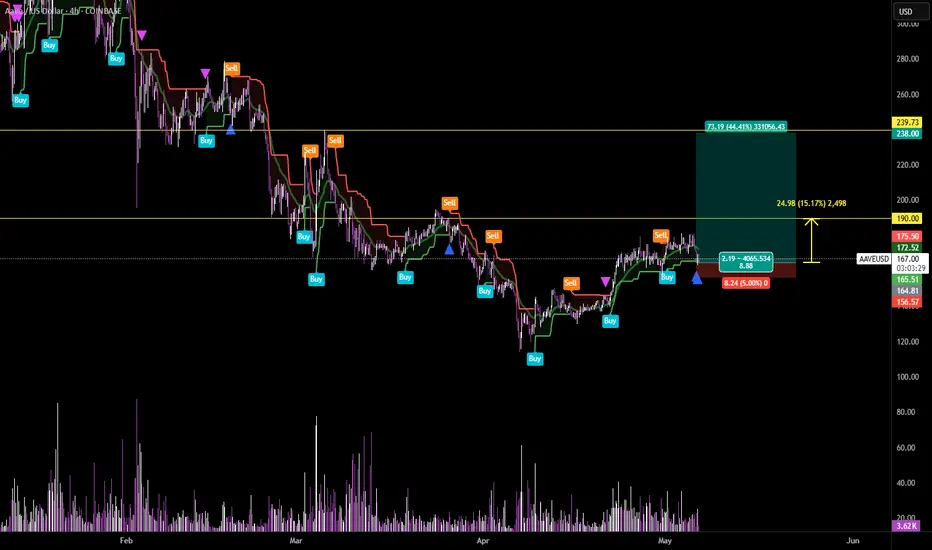
Long AAVE/USDT – Supertrend Touch Play (4H Chart)Entered a long after price tapped the 4H Supertrend and held above the EMA. Clean reaction at confluence support with prior breakout structure acting as a floor.
🎯 Targeting $238 (44.41% upside)
🛑 Stop at $158.65 (-5%)
🟢 Risk-Reward: 8.88R
⚡️ Entry: $166.89
📍 TP1: $190 (local resistance / range high reclaim)
📍 TP2: $238 (full expansion target)
Let’s see if this touch leads to the next leg up or gets faded like the last high. Risk defined, setup clean. Let the market do the rest.
#Crypto #AAVE #TradingView #Supertrend #TA #LeveragePilot #Altcoins #EMA23 #TrendTrading
Long setup on AAVE📈 Funding rate is rebounding strongly → bullish sentiment returning, no overheating signs.
📊 Open Interest is rising again after a flush → healthy new market engagement.
⚖️ Top Traders Long/Short Ratio around 1.9 → slightly bullish but still neutral, no extreme greed.
🛒 Spot CVD shows a strong rebound → real spot buyers stepping in (very bullish).
📉 Futures CVD starts recovering slowly → futures are expected to follow the spot trend.
🔥 Kingfisher Data shows heavy short positioning → potential for a powerful short squeeze.
Conclusion:
✅ Confirmed entry after alignment across Open Interest, CVD, Funding, and Long/Short Ratio.
✅ Monitoring Open Interest and CVD for squeeze confirmation.
✅ Managing the position with a tight stop below local structure to minimize risk.

Something I AAVE to doHow many years have I been learning to trade? A decade plus thus far and things are clicking because its something I AAVE to do.

Price lower, RSI higher. Bullish divergenceAave has some minor bullish divergence a RSI is trending higher while price is lower. Also approaching the meme resistance line. Furthermore, I am bullish Bitcoin. This should theoretically lead to a break out for Aave. Bottoms in.

AAVEUSDTAAVE in buying area, blue demand, time to buy this asset.
lending& borrowing i think good project.
hold this asset till Q4

AAVEUSD Bowl Structure 1000+ An idea showing a large rounded bowl structure with all that's left to come is the bull run side of the bowl
I expect AAVE to go above 1000+ this bull run as per the label
Weekly timeframe for this one.

AAVEUSDT forcast short selling 1:3
1.price in supply area
2.taken liqudity
don't take it, before do your on reserch

bonus buy too many tokens, too cheap prices. buy coins with utility. AAVE is in Trump portfolio.
$160 & $130 looking very fetching~

AAVE - Thank god for markets- Long, strong, sit and smoke bongWow, I was initially frustrated to miss the AAVE move after it broke out of the falling wedge from ATH's in 2021, accumulated sideways into an ascending triangle for over 2 years, and then broke out into its current uptrend.
But now I get to buy 160, be long, strong, sit and smoke the bong. Being both right and sitting tight are difficult to do. Can you?

Looking for LongAAVE is forming steeper flag to make a corrective formation before making a big momentum for the upside, target expecting to reach at $800

AAVE/USD – Recovery After Drop and Potential Upward MoveAfter a sharp decline, AAVE/USD is showing signs of recovery, bouncing from the 250.00 support zone. If the price holds above 262.55, a further move upward is likely.
Technical Analysis:
• Key support: 250.00 – a level where buyers stepped in.
• First resistance: 275.00 – initial target upon breakout.
• Second resistance: 290.00 – next level to watch.
• Expected scenario: If the price confirms a breakout above 262.55, we could see a move toward 275.00, with further potential toward 290.00 if momentum continues.
Trade Plan:
• Entry: After a breakout above 262.55
• Target 1: 275.00
• Target 2: 290.00
• Stop-loss: Below 250.00
The market remains volatile, so it’s important to monitor BTC price action and overall sentiment in the crypto sector.

Possible channel break with 2 possibilities depending DirectionWe have AAVE traveling through a channel after a rally slightly to the downside

Double top setup on AAVE?Looking like a good potential short here to take a continuation of downtrend.


AAVE, Break out and bullish move eminent? Aave looks like it's building momentum that could break out of the bull flag/pennant. A break out of this formation could lead to $175 move in fairly short deration.
The technical trade is the break out and a hold of the break out. If it were to fall back in the zone it is considered a fake out.
Either way you cut it, AAVE is good price here for long term growth.
Let me know what you think AAVE and this analysis down below.
Kind regards
WeAreSat0shi

AAVE/USD sell 2H On the 2H timeframe there is a nice AAVE short opportunity,
You can clearly see the supply zone there so I have a short position open with a 3% gain TP target
