AAVE - the bluest of chips, 4-5x on the wayWhite - an old eth fractal from 2017 that seems to be closely resembling todays AAVE chart. AAVE has been consolidating for the last 6+ months, which gives me confidence that a big move is indeed brewing. Fundamentally I believe it's a great defi project and have personally used it to earn yield on some stablecoins.
AVEUSD trade ideas

Bitcoin Has NOT Topped Out - This Is How It Will MOON
MartyBoots here. I have been trading for 14 - 15 years and I am here to share my ideas with you to help the Crypto space.
Bitcoin & ALT Coins are Setting up for a HUGE bounce and we in CryptoCheck intend to make lifechanging money
ALT SEASON IS NOW - DO NOT BE LEFT BEHIND
------------------------------------------------------------------------------------------------------------------------------------------------------------
If you want help trading Bitcoin or any other ALT coins hit me up , We will improve your trading . Have a look at the link below
------------------------------------------------------------------------------------------------------------------------------------------------------------

AAVE make or breakPrice action on AAVE has been underwhelming recently. However, I am bullish on this project not only beacuse it is a leading defi platform, but also because price is approaching the trendline from 2019-20. Also currently consolidating in a triangle pattern, so we are very close to an area of high confluence. Keep an eye on this one.
Thanks! dyor

the chair.this formation is lit. when defi runs this will melt souls.. life changing wealth... see you in Paris 2022!

AAVE 4H - Upside PotentialHello friends, today I am reviewing the 4H chart for AAVE, a crypto altcoin on a linear scale.
In the chart I noted:
1) The price has been in a descending channel since November 9, 2021.
2) The price hit the bottom long term trendline multiple times on November 18, 2021.
3) The price target for the breakout is around $304, which is a 10% upside. This is also a resistance area.
4) If the price can breakout of the resistance area, it could go as high as $347 or about 25% upside.
5) The Ichimoku Cloud is holding the price down so we may not immediately touch the top of the trendline.
6) The RSI (relative strength index) just broke out of a multi-day trend out of the oversold area.
7) The volume seems very low.
What are your opinions on this?
If you enjoy my ideas, feel free to like it and drop in a comment. I love reading your comments below.
Disclosure: This is just my opinion and not any type of financial advice. I enjoy charting and discussing technical analysis . Don't trade based on my advice. Do your own research! #cryptopickk

AAVE SIGNALS.aave might be bought on these levels and should be sold on upper trend line (former sup-recent res)


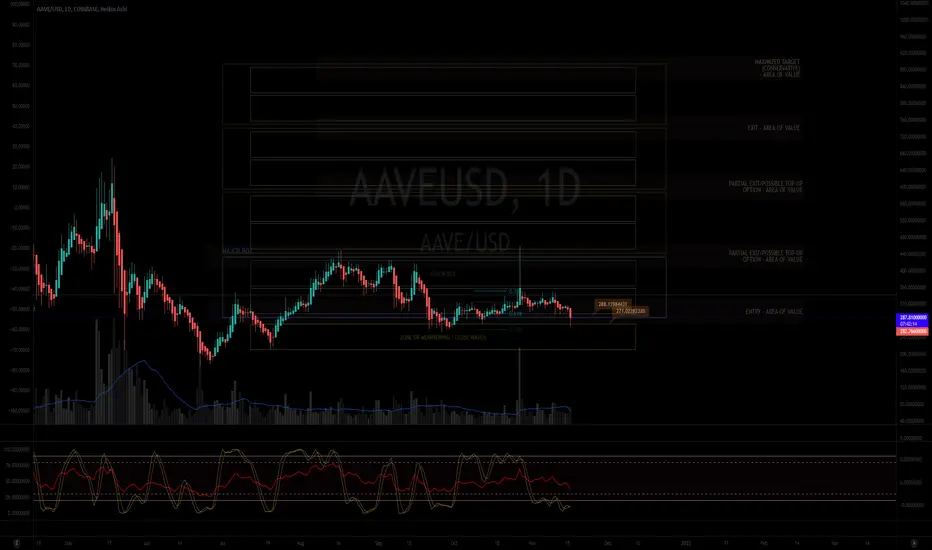
MY MINIMALIST ANALYSIS FOR AAVE$AAVE
11.16.21
2353H +8 PACIFIC
ALERT: ENTRY POINTS
The Market has amazingly moved along the TOPS and BOTTOMS of our BOXES, signifying TURNING POINTS of PRICE ACTION.
JUST DYOR ENTRIES. Watch for Price action/ RSI and STOCH, VOLUME, and FIBS. Set your tight stop loss as any geopolitical, natural/man-made calamities will change the course for our TARGET AREAS OF VALUES.
REMINDER:
INDICATED ARE ENTRIES, PARTIAL EXITS/TOP-UPS, EXITS, and MAXIMIZED AREAS OF VALUE
"FOLLOW THE WHITE RABBIT!"
Just Follow the TOPS and BOTTOMS of the BOXES as a GUIDE where the MARKET will take you.
HOW TO USE THIS MINIMALIST CHART
Created on a MONTHLY, WEEKLY & DAILY Analysis (The Dynamics of the Market.)
It is designed for SWING TRADES at the BOTTOM. I do not SHORT, though, you can still use it.
You can CLICK AND hold THE CHART and PAN or DRAG IT.
TARGET ZONE IDENTIFICATION
The LARGE BOXES (Tops and Bottoms) are MAJOR pivot points that will occur sometime in the future. While the SMALL BOXES (Tops and Bottoms) are MINOR pivot points.
These can be entries to a BUY/ SELL POSITION, EXIT/PARTIAL EXIT/TOP-UP AREAS,
and, if you wish to hold longer for a MAXIMUM TARGET EXIT AREA OF VALUE - CONSERVATIVE (If price action conditions are right at that given moment.)
At times I include WAY BEYOND PARABOLIC Price TARGETS depending on The Character of the Market (CRYPTOS ONLY).
Watch out for your Volume, Chart Patterns, Candlestick Math, FIB COILS ( ABC ), Price Action, FIB LEVELS, Market Dynamics, especially institutional and retailer trading psychology.
Wishing you all The Best Trades and Thank you all for your Appreciation and Support of My Work.
Much thanks to My 3 Mentors. They are so much of a Blessing that I also wish to Share.
Vive Le Autist!
Vive Le Egalitarianism!
AAVE USD Best ALT coin end of year continuedStill looking good for AAVE here, its unanimously been one of the worst top 100 coins traded this year because its been super quite and had no action at all but down it seems. looking at the bigger picture its been in a major Wyckoff re accumulation schematic since february and is looking poised to making its final leg up to 2k to end the year. All the proper phases have been filled to a textbook description. Ive been charting this heavily all year and highly suggest you due your dd on researching it and examples of "Re accumulations"

Aave (AAVE) - November 15Hello?
Welcome, traders.
By "following", you can always get new information quickly.
Please also click "Like".
Have a nice day.
-------------------------------------
(AAVEUSD 1W Chart) - Medium to Long-Term Perspective
Above 101.345455 point: expected to continue uptrend
(1D chart)
First resistance section: 419.933-472.221304
Second resistance section: near 629.086220 point
Support section: 158.491471-210.779774
To break out of the downtrend line, we need to see if we can sustain the price above the 315.356387 point.
A decline from the 278.418499 point may lead to a fall into the support zone, so trade cautiously.
The 300.459751-382.934264 section is a section for sale that is formed in the high point section.
Therefore, you should maintain the price in this area and break out of the downtrend line.
------------------------------------------
(AAVEBTC 1W chart)
Above the 0.002157-0.002829 section: expected to continue uptrend
------------------------------------------
We recommend that you trade with your average unit price.
This is because, if the price is below your average unit price, whether it is in an uptrend or in a downtrend, there is a high possibility that you will not be able to get a big profit due to the psychological burden.
The center of all trading starts with the average unit price at which you start trading.
If you ignore this, you may be trading in the wrong direction.
Therefore, it is important to find a way to lower the average unit price and adjust the proportion of the investment, ultimately allowing the funds corresponding to the profits to regenerate themselves.
------------------------------------------------------------ -----------------------------------------------------
** All indicators are lagging indicators.
Therefore, it is important to be aware that the indicator moves accordingly with the movement of price and volume.
However, for the sake of convenience, we are talking in reverse for the interpretation of the indicator.
** The MRHAB-O and MRHAB-B indicators used in the chart are indicators of our channel that have not yet been released.
(Since it is not publicly available, you can use this chart without any restrictions by sharing this chart and copying and pasting the indicators.)
** The wRSI_SR indicator is an indicator created by adding settings and options to the existing Stochastic RSI indicator.
Therefore, the interpretation is the same as the traditional Stochastic RSI indicator. (K, D line -> R, S line)
** The OBV indicator was re-created by applying the formula to the DepthHouse Trading indicator, an indicator disclosed by oh92. (Thanks for this.)
** Support or resistance is based on the closing price of the 1D chart.
** All descriptions are for reference only and do not guarantee a profit or loss in investment.
(Short-term Stop Loss can be said to be a point where profit and loss can be preserved or additional entry can be made through split trading. It is a short-term investment perspective.)
---------------------------------

AAVE, the fairy is showing the way.On October 27, it skyrocketed, but it didn't stay for too long and then fell back.
It is currently rebounding and it is expected to cover part of the upper shadow line.
Walk along the trend line and go long near the trend line.
Near target 420.

AAVE due to break wedge todaybeen in aave since $310, hoping we break the wedge today after coming back to retest the break of the higher time frame triangle.

AAVE upside potentialAAVE will try to break the 345 level today with the bullish market. Once it breaks RES 400+ will be the next target for the coming sessions.


AAVE Fibonocci Extensions on the Weekly ChartGolden Cross Impending. Bullish divergence on RSI MACD. The 4.236 fib extension is at $2750. That doesn;t seem to far away imo.


AAVE: geared for all-time-high againa few things for price uptick:
RSI not overbought, potential for rising further.
There seems to be a trend, judging from rising bottoms.
chart pattern - symmetrical triangle with a potential for breakout.
Potential risk remains.

AAVE Fibonocci Extensions on the Weekly ChartBINANCE:AAVEUSD AAVE has been trading sideways forming a nice bull pennant. Here are the fibonocci extensions on the weekly chart assuming the swing low of June 21 of $163 is the pivot.

AAVEUSD D2: THE BEST Level to BUY/HOLD 400%+ gains(SL/TP)(NEW)Why get subbed to me on Tradingview?
-TOP author on TradingView
-2000+ ideas published
-15+ years experience in markets
-Professional chart break downs
-Supply/Demand Zones
-TD9 counts / combo review
-Key S/R levels
-No junk on my charts
-Frequent updates
-Covering FX/crypto/US stocks
-before/after analysis
-24/7 uptime so constant updates
🎁Please hit the like button and
🎁Leave a comment to support our team!
AAVEUSD D2: THE BEST Level to BUY/HOLD 400%+ gains(SL/TP)(NEW)
IMPORTANT NOTE: speculative setup. do your own
due dill. use STOP LOSS. don't overleverage.
🔸 Summary and potential trade setup
::: AAVEUSD D2 chart review
::: updated/revised outlook
::: overall strong chart
::: BULL FLAG pattern
::: focus on buying lower later
::: final swipe lower possible/likely
::: but then expect MASSIVE GAINS
::: chart looks good /strong
::: still valid today / great setup BULLS
::: BULL FLAG setup with massive upside
::: still expecting pullback off the highs
::: get ready to BUY LOW later
::: accumulation in range previously
::: then we had 650% gains PUMP
::: we had 2 pumps already before this
::: 450% pump - pullback
::: then 450% pump and now pullback mode
::: expecting short-term pullback
::: BULLS get ready to BUY after pullback
::: TP bulls is +700% gains later
::: expecting decent gains soon
::: 30-40% pullback short-term
::: recommended strategy: BUY/HOLD after pullback
::: TP BULLS +400% gains
::: SWING TRADE: BUY/HOLD IT
::: bull run not over yet
::: good luck traders!
::: BUY/HOLD and get paid. period.
🔸 Supply/Demand Zones
::: N/A
::: N/A
🔸 Other noteworthy technicals/fundies
::: TD9 /Combo update: N/A
::: Sentiment mid-term: BULLS
::: Sentiment short-term: BEARS/PULLBACK
RISK DISCLAIMER:
Trading Crypto, Futures , Forex, CFDs and Stocks involves a risk of loss.
Please consider carefully if such trading is appropriate for you.
Past performance is not indicative of future results.
Always limit your leverage and use tight stop loss.

AAVEAAVE Not looking so good.. chart in a bear flag / descending triangle AND Justin sun withdrew 4.2 billion from AAVE pools.. spooky szn

$AAVE ready to turn$AAVE should see more to the upside after breaking the downtrend line (DTL) and key exponential moving averages crossing over.

Aave (AAVE) - October 27Hello?
Welcome, traders.
By "following", you can always get new information quickly.
Please also click "Like".
Have a nice day.
-------------------------------------
(AAVEUSD 1W Chart) - Medium to Long-Term Perspective
Above 206.817161 point: Expected to create a new wave.
(1D chart)
First resistance section: near point 315.356387
Second resistance section 419.933-472.221304
Support section: 158.491471-210.779774
If the price holds at the 315.356387-419.933 zone, I expect it to turn into an uptrend and move towards the second resistance zone.
To accelerate the uptrend, it needs to rise above the second resistance section.
A decline from the 278.418499 point may lead to a downward trend, requiring a short-term stop loss.
------------------------------------------
(AAVEBTC 1W Chart) - Mid-Long-Term Perspective
Above the 0.002157-0.002829 section: expected to continue uptrend
(1D chart)
First resistance section: near the 0.007364 point
Second resistance section: 0.009798-0.011016
Support period: 0.003712-0.004930
The price needs to remain above the 0.006650 point to turn into an uptrend.
------------------------------------------
We recommend that you trade with your average unit price.
This is because, if the price is below your average unit price, whether it is in an uptrend or in a downtrend, there is a high possibility that you will not be able to get a big profit due to the psychological burden.
The center of all trading starts with the average unit price at which you start trading.
If you ignore this, you may be trading in the wrong direction.
Therefore, it is important to find a way to lower the average unit price and adjust the proportion of the investment, ultimately allowing the funds corresponding to the profits to regenerate themselves.
------------------------------------------------------------ -----------------------------------------------------
** All indicators are lagging indicators.
Therefore, it is important to be aware that the indicator moves accordingly as price and volume move.
However, for the sake of convenience, we are talking in reverse for the interpretation of the indicator.
** The MRHAB-O and MRHAB-B indicators used in the chart are indicators of our channel that have not yet been released.
(Because it is not public, you can use this chart without any restrictions by sharing this chart and copying and pasting the indicators.)
** The wRSI_SR indicator is an indicator created by adding settings and options to the existing Stochastic RSI indicator.
Therefore, the interpretation is the same as the traditional Stochastic RSI indicator. (K, D line -> R, S line)
** The OBV indicator was re-created by applying a formula to the DepthHouse Trading indicator, an indicator disclosed by oh92. (Thanks for this.)
** Support or resistance is based on the closing price of the 1D chart.
** All descriptions are for reference only and do not guarantee a profit or loss in investment.
(Short-term Stop Loss can be said to be a point where profit and loss can be preserved or additional entry through split trading. It is a short-term investment perspective.)

BigRun for AAVE Target $800Get in now!! AAVE broke lond descending channel and I am expecting quick run here..
