Axie Infinity | Another Gem... Make It 1000% (Buy & Hold StratAre you in it for the money or what?
What are you in it for?
The project?
The people?
The technology?
The philosophy?
The money?
The opportunity?
The experience?
The fun?
It doesn't matter what you choose, you are welcomed to join.
It is not that the "bottom is truly in," as we like to say, in some cases, it is that I am predicting a bottom.
By bottom you mean to say that no lower prices are likely.
This is not always true because some signals are weak others are strong.
We can predict a bottom and prices move lower, just a little bit more and then, BOOM!, massive growth.
It is implied that you understand that we are not perfect, I can get the wrong timing more than once, and that's ok.
If the bottom is not already in, it is getting very close. As it gets closer and closer, you need to prepare, or better yet, join the ride through buy and hold.
My strategy is always the same; buy and hold, but I won't share it... It has been proven over time to lead to great success.
Buy and hold is the secret strategy that I would like to share with you today.
If you try to buy and sell without experience, you can end up losing some opportunities and diluting your capital rather than increasing or maximising your potential profits results.
Pick the projects you like, go with your intuition, some people call it your "gut." Make your choice and focus on the long-term. You will be glad to be in once the market turns.
We will have massive growth in 2025.
The only way to experience and enjoy 10, 15 and sometimes even 20X, is buy (by?) joining at the bottom and letting the market take care of the rest.
Is the bottom in?
👉 Buy and hold!
That's the strategy.
That's the point.
That's the goal.
You cannot do anything else.
There is no complexity.
There is nothing to do, you can just enjoy your free time while the market grows.
In 2025 remember... You can even hold until 2029 or beyond.
But, buy when red, that's the most important part —when prices are low.
Namaste.
AXSBTC trade ideas

#AXS/BTC - Long - Potential 2.61%DIRECTION: LONG
MARKET: SPOT
RISK: 0.25% - 1%
#BTC_AXS
EXCHANGE: BINANCE
TIMEFRAME: 60
BUY: 0.0001761
TP1: 0.00018009
STOP: 0.000174
Entry Conditions:
- Pullback after rejection from 200MA
- Trend flipping bullish short term
- Active break of trendline / bullflag

#AXS/BTC 1D (#Binance) Falling wedge breakoutAxie Infinity just regained 20EMA support in satoshi, looks ready for a small recovery towards 100EMA.
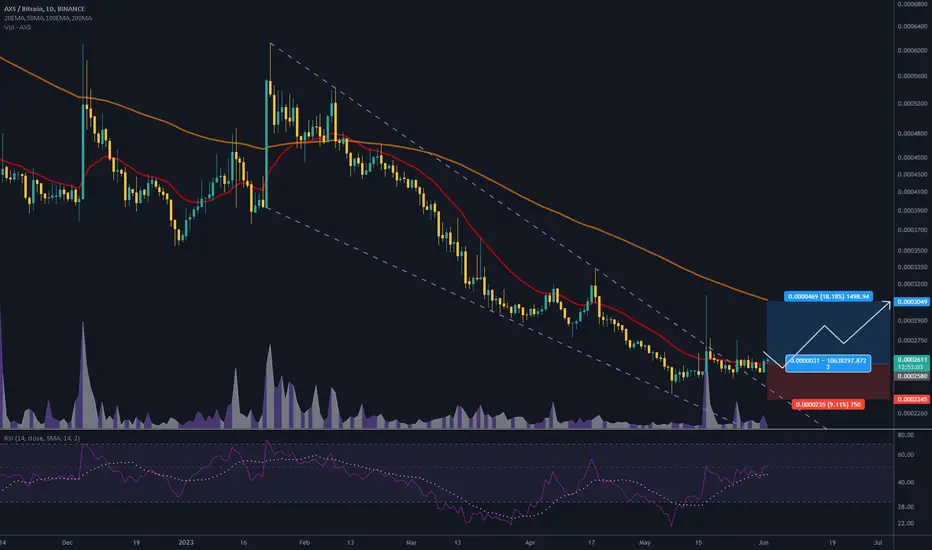
⚡️⚡️ #AXS/BTC ⚡️⚡️
Exchanges: Binance
Signal Type: Regular (Long)
Amount: 11.0%
Current Price:
0.0002580
Entry Targets:
1) 0.0002611
Take-Profit Targets:
1) 0.0003049
Stop Targets:
1) 0.0002345
Published By: @Zblaba
NYSE:AXS #AXSBTC #AxieInfinity #P2E #NTF #Ronin axieinfinity.com
Risk/Reward= 1:2
Expected Profit= +18.2%
Possible Loss= -9.1%
AXS/BTC - Long - Potential 6.25%Direction: Long
Market: Spot
Risk: 0.25% - 1%
#BTC_AXS
Exchange: BINANCE
Timeframe: 360
TP1: 0.0002924
Entry: 0.0002755
STOP: 0.0002586
Entry Conditions:
| Resistance break

#AXS/BTC - Long - Potential 6.89%Direction: Long
Market: Spot
Risk: 0.25% - 1%
#BTC_AXS
Exchange: BINANCE
Timeframe: 360
TP1: 0.0003322
Entry: 0.0003107
STOP: 0.0002892
Entry Conditions:
| Trendline Breakout
| Volume confirmed

Axie Infinity (AXS) formed bullish Butterfly for upto 128% rallyHi dear friends, hope you are well and welcome to the new update on Axie Infinity ( AXS ) token.
Previously we caught more than 54% pump of AXS as below:
On a daily time frame, AXS has formed a bullish Butterfly move for another price reversal.
Note: Above idea is for educational purpose only. It is advised to diversify and strictly follow the stop loss, and don't get stuck with trade

#LQR #TOBTC #AXS Add me to your Watchlist..!#Watchlist
These important Resistance on the way are to critical

✳️ Axie Infinity Looks Good Good potentialGood potential here, Axie Infinity vs Bitcoin is breaking out now and has potential for growth.
You can find additional details on the chart.
Namaste.

AXSBTCJust an idea....AXSBTC is very bullish to me...If it keep channel and brake it it will make IHSand to me a huge profit... Just an Idea...

Axie to Infinity?Last month, AXS finally broke through the downtrend resistance. Now price appears to be consolidating above the resistance-turned-support line and dipping its toes into the supply zone. With the recent Bullish Divergence (4h) and with the indicators entering buy zones, AXS looks like a great opportunity for averaging into a long position.
To infinity!
----------------------------------------------------------------
These are my personal views and not financial advice. Please do your own research before investing.
I'd love to hear your thoughts, ideas and feedback. Feel free to Comment and I'll try and get back to you quickly.
If you appreciated this analysis, consider Liking or Following . Thanks!

AXSBTC+50%yup It's suitable for Bitcoin pair.
Tpx: in chart
Ep with Yourself or Go see in the previous chart.

Axie Infinity Daily Chart AnalysisYesterday we looked at Axie Infinity (AXSBTC) on the weekly/long-term chart... Today we will have a look at the daily timeframe.
First, we can see how nicely EMA50 and EMA100 match the Fibonacci numbers.
We have the highest volume bar since November 2021 and a break above EMA50 yesterday and EMA100 today.
Bullish indicators, MACD and RSI.
Now, my reason to post this is to show you the next target.
The main resistance short-term for this bullish move is the 1.618 Fib. extension level at 0.002061.
It is possible to have a correction or small retrace after this level is reached and then another jump to 2.618 Fib. which is sitting at 0.002633.
If you are trading this daily, you now have a better view of what is going to happen next.
I hope you enjoyed this analysis.
Thanks a lot for the continued support.
I Love You! :D
Namaste.

Axie Infinity Eternal Uptrend vs Correction, Bullish Jump Ahead!Here is one of those Altcoins with an "Eternal uptrend".
We can see the classic 5 wave count from our friend R.N. Elliot, followed by an ABC correction that landed at EMA50 and/or the 0.618 Fib. retracement level for the last bullish wave.
This can signal that a new jump is about to take place.
Zoom in on the correction:
We can see the descending channel being broken.
EMA50 working as support.
The new +1 count on the TD sequential,
A this weekly candles bullish jump.
How do you like it?
Thanks a lot for the continued support.
Namaste.

AXSBTCGeneral Guide:
1.) Anything above price is a resistance, anything below is support.
2.) Proceed with caution when taking a trade based off of this chart.
3.) Make a copy of it to watch it in real-time. Click the share button, then "Make it Mine"
4.) It is very risky to set limit orders, I advise you to set alarms and when it hits, check how it reacts.
5.) Watch the BTC pair closely as price will generally follow that pair.
6.) Definition of Terms:
Bearish/Bullish Order Block (OB) - Price rejects or bounces respectively.
(Monthly/Weekly/Daily) Liquidity - Where retail stop loss orders are.
pm/pw/pd/pr - Previous Month/Week/Daily/Range
VAH/VAL/POC - Value Area High/Low and Point of Control (70% of traded volume in a range)
OTE - Optimal Trade Entry
Rectangles - Liquidity Pools
Diagonals - Probably a Fib Resistance Fan, Pitchfork or Pitch fan
nPOC - Naked Point of Control
Eq - Price Equilibrium
Single Prints - Liquidity Voids

AXS looking for supportAXS has pulled back to the 200 EMA and is looking for support. I don't see an obvious Trend Support line, so I'm looking to the Supply Zone (area where a lot of trading has taken place in the recent past) to provide a respite for the bulls. We've entered my "buy zone" but I want to see divergence/confirmation before I consider an entry. Sellers appear exhausted so I'm expecting at least a short-term bounce at least up to resistance. Whether or not it can break that resistance, I'm not sure.
----------------------------------------------------------------
These are my personal views and not financial advice. Please do your own research before investing.
I'd love to hear your thoughts, ideas and feedback. Feel free to Comment and I'll try and get back to you quickly.
If you appreciated this analysis, consider Liking or Following . Thanks!

AXS Holding a Bull Flag PatternAXS Holding a Bull Flag Pattern However, AXS is losing value almost weekly since late October. It doesn't seem that the bears are done selling yet as we getting closer to the pull flag lower end.

SHORT AXSBTCShort AXSBTC
I will entered this trade after a break below and retest of below 2000 sat zone
Entry trigger 4H close below 1950 sats
1st target 1680 sat zone
2nd target 1460 sat zone
Invalidation day close above 2350 sat zone

AXS little swingAXS/BTC long little swing for the next days. Careful with corona status, dump might be coming soon

AXSAXS USDT pair and BTC pair both are pretty good I bought in spot for midterm
targets on the chart for each other.

AXS/BTC buy opportunityHi followers,
BINANCE:AXSBTC maybe ready to another up move to retest the highs from the beginning of October.
Don't forget to manage your risk! 👌
Good luck and trade with care 🙏
If you like my content - 👍 Like, 💬 comment, 👆 follow and 👉 share!
❗❗❗
Disclaimer: This information is not a recommendation to BUY or SELL. It is to be used for educational purposes only!

# AXS/BTC also good __AXS/BTC pair break descending triangle resistance on 4H.If AXS trade above the resistance trendline, the next resistances after breakout are 0.002460 - 0.002560 area and next one is 0.003150 - 0.003280 area.
If AXS unable to trade above trend line then we will see a retest of 0.001850 - 0.001655 support area . Wait for a breakout or rejection from there.
*DYOR*

Flag Breakout SoonFlagging into the 21 day. Previous couple times this happened, AXS ripped the next few days. Anything is possible with this one.

AXSBTC buy once resistance breakLets go AXS!
I love buying resistance break with a stop loss tight as 3%.
