Scoop Axie in the $6-7 range
Axis has been ranging and consolidating for over 6 months now and has been making some bullish high volume moves lately. It could still drop another dollar to previous lows and be bullish from there; but I anticipate it making a higher low before then. BTC looks like FWB:25K support, so that could help fuel an alt rally.
First target in the $9-10 range; but it could go much higher, The all time vwap is in the 30s which I will show in the macro chart below.
AXSUSD trade ideas

AXS long setupGaming/meta play. Looking to scale into position on 15/30 min chart flat support levels. Target 1 127% fib extension, target 2 161% fib extension

AXSUSD 1h Time Frame AB=CDAXSUSD 1h Time Frame
There is no divergence on the RSI and we can see a AB=CD Harmonic pattern.
Entry Point: 9.26
Stop Loss: 8.84
Take Profit: 9.69
Risk: 1%

#AXSUSD - Huge Short Coming off After Huge Long!We closed a large Long trade of 56% gains with #AXS yesterday, it was a good day - and this wasn't even the best trade of the day! :)
Coming off the back of that success we've got a good Sell signal from Crypto Tipster v2, price tested and was rejected by this descending trend line and there's a reasonable gap for the price to fall until recent support levels are hit.
TP1 should net you 20% on this Short trade, if TP2 get's hit you'll be looking at nearly 50% - awesome.
If you enjoyed or agree with this idea - drop us a comment, like & follow! :)

AXSUSD (Daily) - Bearish wave We2Hi Traders
AXSUSD (Daily Timeframe)
A medium probability, entry signal to go SHORT will be given with the downward break of 7.80 after the market found resistance at 9.85. Only the upward break of 9.85 would cancel the bearish scenario.
Trade details
Entry: 7.80
Stop loss: 9.85
Take profit 1: 5.05
Take profit 2: 3.05
Score: 6
Strategy: Bearish wave We2

AXSUSDT | Bearish Trend Reversal - Sell StopAXSUSDT is showing a bearish trend reversal on a rising wedge trend because of RSI divergence, hence we will take sell stop trade at the break of the previous HL.

Gartley bearish The gartley pattern in 1-hour time frame trade on your own risk follow money management thanks


Yet another $AXS fake-out- $AXS has no revenue to validate its FDV anymore, tokens still unlocking, narratives rotating.
- Continuous range to range breakdown vs USD and vs BTC, extreme weakness.
... waiting for closes under $10.2 for short-entry and nuke if it comes.


AXS still long IF BTC stays long$AXS $Axie is hugging the bottom trendline as of now. But if Bitcoin stays strong we can see a break to the upside as high as $15. If not, a drop to $10 is in sight.


LONG Possible Cloud Breakout IncomingAXSUSDT Long ! I suggest spot because it has some very aggressive retracements that could get you stopped out from your position. So spot AXS with targets from 10 upto 14 !
To confirm our strong buy bias we need to see first a breakout of resistance as highlighted in the graphic.
Ichimoku Cloud breakout incoming in the coming days! Wait for all lines pointing upwards before getting in ☁️
Happy trading!

Axie infinity heading towards top trendline of bearflagIf it were to break upwards from its bearflag like we have seen other cryptos in a similar pattern do recently such as solana its measured move breakout target is over 6x! No guarantee it will though and often times after several cryptos have already hit their break out targets the alt coins that are lagging behind don’t always hit their full targets. A correction is bound to happen in the near future after such a pump so must tread carefully on this one..I was dollar cost averaging and bought a decent amount the current low so I’m good no matter which way it heads. It is clearly mirroring the bearflag pattern seen on other game based alts like gala, sand, mana, and then also ones found on solana and qnt. *not financial advice*

$AXS back @ support$AXS back @ support & harder to call it this time
Fully diluted still pretty bad
#AXS longer term not good
Weekly it's oversold though
We did say this was likely not going to be top dog in future, could get nice bumps here & there
#metaverse #altcoin #crypto #NFT

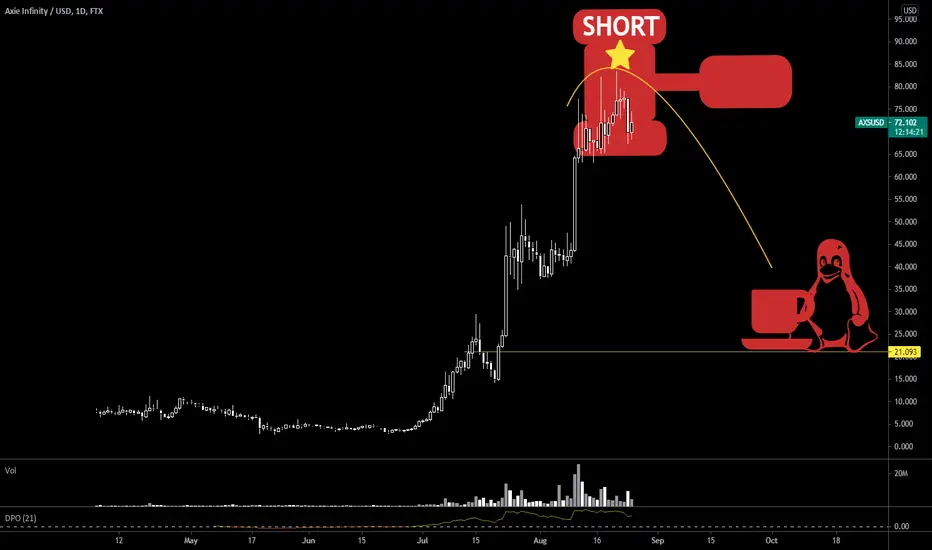
AXiE: $75 | when everyone is on board time to shortbanker cashing in and moving funds to next play or theme

MY MINIMALIST CHART ANALYSIS FOR AXIE INFINITYAXS
01 .21.22
1141H +8 SINGAPORE
Disclaimer:
The findings of the following analysis are the sole opinions of the publisher of this idea and should not be taken as a piece of investment advice.
This will be a good season for ENTRIES. Market has found strong support at a very bargain price for cryptos.
We will be focusing on BITCOIN and ETHEREUM as our TOP CRYPTOS. As for ALTS, ADA, POLKADOT, MANA, SAND, CURVE, MATIC and a few others.
Basically, the outcome of BITCOIN , the ALTS tend to follow. So I am limiting my published ideas to a few, quality over quantity.
ALERT:
Looking now for an ENTRY to a short to midterm LONG SWING trade.
Based on VITAL SIGNS ( RSI , STOCH , VOL., MA VOL.) Looks healthy:
1. RSI still midway down
2. STOCHS on the LOW
3. Volume has a lot of supply for BUYERS to TAKE.
4. Looking at support at 54-65 zone.
5. We can then expect a strong hey level of support at the 77 zone, right at the bottom of the MAJOR BLUE BOX and the ENTRY AREA OF VALUE MARKER.
Hoping that the market does not break any MAJOR or MINOR BOTTOM of our BOXES. Again, if it does, it will be a BUYERS MARKET and good for as all RETILERS.
Looking back months ago when the MINIMALIST BOX ANALYSIS was made.
The Market had amazingly moved along the TOPS and BOTTOMS of our BOXES, signifying TURNING POINTS of PRICE ACTION, and verified by major FIB levels.
Hoping that this MINIMALIST BOX CHART ANALYSIS will efficiently help you with your DYOR as we climb a NEW SWING CYCLE.
INSTRUCTIONS:
HOW TO USE THIS MINIMALIST CHART a.k.a (Bento Box)
"FOLLOW THE WHITE RABBIT!"
Just Follow the TOPS and BOTTOMS of the BOXES as a GUIDE where the MARKET will take you.
PUBLISHED IDEA is created on a MONTHLY, WEEKLY & DAILY Analysis of a MARKET'S CHARACTER.
It is designed for SWING TRADES at the LOWEST or START of a SWING CYCLE.
Q/A : What are the BOXES for? It is a ROAD MAP for TARGET ZONES IDENTIFICATION.
The LARGE BOXES (Tops and Bottoms) are MAJOR turning points that will occur sometime in the future. While the SMALL BOXES (Tops and Bottoms) are MINOR turning points.
These can be entries to a BUY/ SELL POSITION, EXIT/PARTIAL EXIT/TOP-UP AREAS, as well as Support and resistance levels
Also includes MAXIMUM TARGET EXIT AREA OF VALUE - CONSERVATIVE (If price action conditions are right at that given moment.)
If it cannot break a TOP or BOTTOM of a BOX, It signifies a reversal.
At times I will include a WAY BEYOND PARABOLIC PRICE TARGET, depending on The Character of the Market (CRYPTOS ONLY).
DYOR for your Volume , Chart Patterns, Candlestick Math, FIB COILS, Price Action, FIB LEVELS, Market Dynamics, especially institutional and retailer trading psychology .
Stay away from FOMO and FUD.
NOTE: That PRICE TARGETS for ENTRY and EXITS are DYNAMIC and can CHANGE from time to time.
My Published Ideas are not 100% Accurate. There are many factors at a given time that can change the forecast.
It is all based if the right conditions are met. Generally it will follow the MINIMALIST BOXES.
Wishing you all The Best Trades and Thank you all for your Appreciation and Support of my work.
Much thanks to my 3 great mentors. They are so much of a blessing that I also wish to share my knowledge on what I was taught.
Vive Le Autist!
Vive Le Diamond Hands!

AXSUSD Big pump on but nothing changes until this breaksBig rebound on Axie Infinity since yesterday but it is nothing we haven't seen before. The price did break above the 1D MA50 but remains within the 1 year Falling Wedge. The one line that hasn't been broken or even tested since January 5th is the 1D MA200 . A break above it, being near the top of the Wedge, and AXSUSD is off to its new bull market.
Follow us, like the idea and leave a comment below!!

Axie Infinity to $2050: King of NFT Based Video GamesAxie Infinity's all time wave structure suggests that the NFT based video game is due for a major run. Based on the science of Elliott Wave Theory, I believe AXS has one of the cleanest and perhaps most undeniable setups.
Can a 11000% increase in value really manifest?
:)

Bottom is coming so be patientWaiting is a personal choice.
No forcast yet until 2023.
Observing and sharing my work.
Details will be updated soon.

AXS Axie Infinity: Another 50% DropHello friends, today you can review the technical analysis idea on a 1D linear scale chart for Axie Infinity (AXSUSD).
AXS price could drop another 50% to the $2.50 range or possibly lower. Crypto gaming has feel apart as much as DeFi and NFTs, so I am concerned that more drop is coming.
The chart is self-explanatory. Included in the chart: Trend line, Support and Resistance Line, Volume Profile VPVR, Ichimoku Cloud, RSI, Keltner Channels and Volume.
If you enjoy my ideas, feel free to like it and drop in a comment. I love reading your comments below. More ideas below!
Disclosure: This is just my opinion and not any type of financial advice. I enjoy charting and discussing technical analysis. Don't trade based on my advice. Do your own research! #millionaireeconomics

AXSUSD Above the 1D MA50 but must break this for new Bull CycleAxie Infinity (AXSUSD) broke today above the 1D MA50 (blue trend-line) for the first time since August 18 and continues to trade within the pattern we suggested on our last idea (August 31):
As you see, since the price failed to break above the 1D MA50 at the time, it followed the Jan - April fractal as projected and dropped to our 8.50 target and even slightly lower. With the Vortex Indicator (VI) printing a pattern similar to the July 18 1D MA50 break-out, we may be starting a new Megaphone consolidation again. The 1.382 Fibonacci extension is not that far so we can be more positive this time. However we won't be engaging in any long-term buying until the 1D MA200 (orange trend-line) breaks, which has been the Resistance since January 05 2022.
-------------------------------------------------------------------------------
** Please LIKE 👍, SUBSCRIBE ✅, SHARE 🙌 and COMMENT ✍ if you enjoy this idea! Also share your ideas and charts in the comments section below! This is best way to keep it relevant, support me, keep the content here free and allow the idea to reach as many people as possible. **
-------------------------------------------------------------------------------
You may also TELL ME 🙋♀️🙋♂️ in the comments section which symbol you want me to analyze next and on which time-frame. The one with the most posts will be published tomorrow! 👏🎁
-------------------------------------------------------------------------------
👇 👇 👇 👇 👇 👇
💸💸💸💸💸💸
👇 👇 👇 👇 👇 👇
