Axie Infinity bottom in at $17 then take off! AXS trend down, bounce off bottom out of channel and into the new up trend.
Not trading advice. Pure speculation.
AXSUSD trade ideas

AXS - UPDATED CHARTSupport at 20$, Resistance at 23$ and once/if over then off to 29$- this is the most likely scenario...that means that the market helps.
If the situation does not help then we have a clear entry for a short at 19$ all the way down to 13,8$.. this is the unlikely scenario but still it exists.
News:
Binance CEO Says Axie Infinity Handled Its Crisis Better Than Terra With UST Depeg
In a Twitter thread, the Binance boss shared his disappointment in how Terraform Labs team handled its ecosystem’s collapse.
One Love,
the FXPROFESSOR

AXS - Back On The RISEAXS needed a break and to touch base with reality... and now is time for Higher
That's our chart saying, not sure about the fundamentals and all but Play to Earn sounds like a winner.
Have some fun and read this now : ''My brief wondrous life as an Axie Infinity gamer''
Crypto rookie Joel Stein dives into Axie Infinity and the curious economics of ‘play to earn.’ Will his teenage gaming dreams come true?
''Of course I want to play to earn. I want to earn money doing all the things I enjoy. Eat to earn? Sure. Watch TV to earn? I’m in. Sex to earn? Historically that’s had complications, but I’m confident that the blockchain can work those out. ''
REF: forkast.news
One Love,
the FXPROFESSOR
Axie Infinity (AXS) to $80Just a quick and obvious trade (i.e. days / weeks), not a long term view (usually my ideas are focused on weeks and months).
On the 12hr chart above a bullish divergence prints following a ‘incredible buy’ signal.
Take profits at $80. Look for support after resistance to continue with long positions.
Good luck,
WW

AXIE getting the ax.Looks bad... OBV strong downward resistance. Possibly visit 6$. first stop 17$. best of luck yall

$28 bottom for AXIE INFINITY before rising to new ATH. Just an idea. Some pullback before we see some growth..
Not trading advise. Just an observation.

Axie Infinity bullish? Maybe, and this is why.Disclaimer: This is a Newbie analyses with no past Experience! so please Take it Easy
Axie infinity technically looking neutral at the moment. At least, until early/mid May.
The 4hr Candlestick chart suggests the same pattern could be repeated with a fake high in few days maybe, then early/mid May we breakout bullish probably UNLESS the 45 support level is violated prior.
RSI indicator suggesting the same pattern as well.
This is not a financial advise!
Please comment your ideas about the analyses as I am new and want to learn from your experience and knowledge.
Appreciate your constructive comment and feedback in advance.

AXS IS SITTING AT THE LOWER BORDER OF A CHANNEL. Overall, cryptocurrency has been CONSOLIDATING and this is a reflection of BTC as the leader of the market.
AXS experienced some massive ride up before falling to the present level.
Do big question is: what is going to happen from here?
I AM BULLISH LONGTERM.
Share your thoughts, comment, like and follow for more ideas.
AVAX / USD AVAXUSD It looks like a rising wedge, which is bearish. All I want to see a breakout and retest.

AXSUSD Strong Support EncounteredAxie has broken out of a strong resistance within a down movement, simultaneously hitting a large support while doing so
This could be indicative of a reversal out of this small bear action we have seen
Daily Chart

AXSUSD (1H) Bearish breakoutHi Traders
AXSUSD (1H Timeframe)
The market is in a downtrend, and we are waiting for an entry signal to go SHORT below the 52.1 support level. Only the upward break of 55.86 would cancel the bearish scenario.
Trade details
Entry: 52.10
Stop loss: 55.86
Take profit 1: 49.78
Take profit 2: 46.05
Score: 8
Strategy: Bearish breakout

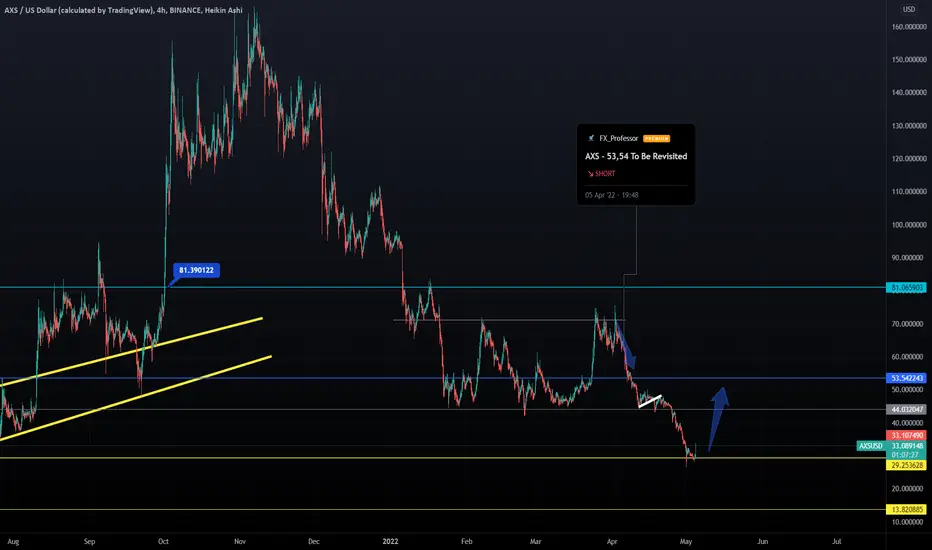
AXS - 53,54 To Be RevisitedApart from the recent bad fundamentals ( $600 million Axie heist ), the chart agrees:
AXS is under support and will most likely need to revisit the 53,54 level.
We are short already ehre since last week since we always hedge and it usually works.. our AXS short positions will remain until that support at 53,54
One Love,
the FXPROFESSOR

AXS - Video Top-Down Analysis!Hello TradingView Family / Fellow Traders. This is Richard, as known as theSignalyst.
Here is a detailed update top-down analysis for AXS .
Which scenario do you think is more likely to happen? and Why?
Always follow your trading plan regarding entry, risk management, and trade management.
Good Luck!
All Strategies Are Good; If Managed Properly!
~Rich

Axs Easy 20% trade #axsAxs is showing a fantastic double bottom pattern followed by a bull flag to break to the upside.
This is s measure move and the chart tells it all. The red line is the 200 MA that serves as resistance. That is where i am looking to take profits. A move below $62 will invalid this pattern and that is where my Stop Loss will be.
Happy trading.

AXS/USD Ready For A Big Move!We provide a video analysis of AXS/USD and why we believe price is ready to break through resistance . DM me if you would like to learn more about our Oscillator.

AXS SwingAXS/USD: Short to Mid-term Swing, LV Refill
Approx 20% gain from current PA to minimum 1.618 Fibonacci (84.8 USD)
Suggested Take Profit: 1.272 Fibonacci (79 USD)
Target Price Limit Sell: 84.8 to 90.6 USD
Invalidation Zone: Under 63 USD
Please allow 2-14 days for Swing
Not financial advice, DYOR
Be sure to subscribe for more easy-to-follow VSA swing charts & updates!

AXS / USD We are in a downtrend, but once it breaks this downtrend will go long and my first target will be at 80

AXS - Potential Bullish Reversal!Hello everyone, if you like the idea, do not forget to support with a like and follow.
AXS rejected our green demand zone and traded higher.
AXS broke the last minor high in orange, and the two upper trendlines (orange and red)
Thus, the bulls took over from a medium-term perspective. and the first blue projection is considered our first impulse of the bullish trend.
We are currently in a correction (in purple), and waiting for the bulls to break the upper gray area for the bulls to take over from a long-term perspective and the next bullish impulse to start.
Meanwhile, until the bulls break above the gray area, we are in a short-term correction phase that can trade till the green zone.
Good luck!
All Strategies Are Good; If Managed Properly!
~Rich

bart patternIt could play out or maybe it will not I do not decide the future but it is plausible as this went tits up with the hack earlier today

Axie Infinity looking good for long entry!!Axie infinity gave a good momentum from the support zone shows strength in bulls and is now consolidating near resistance marked in red zone any move above 76 can be seen as a long opportunity and sl can be placed below the consolidation zone.

Axie Moving UpAXS/USD is in a bull flag pattern with a potential break out. Watch BTC sentiment for directional bias. NFA, DYOR

AXS **FLAG** formation = Online 🔥🔥Just wait breakout :)
CUP and HANDLE formation target at least 91 USD.

AXSUSD Rejection at breakout point or catching it's breathI picked up some AXS at the bottom of the range and looking for it to break out before adding. Took a strong move up to the top of the range but could get rejected. However it is Saturday so volume not ashigh compared to the last couple of days, which was a pretty good move. Note the volume poc's clearly showing the range. Ultimately it really depends on the market and not likely to sky on it's own. Not sure if i'm a hodler on this yet but keeping it on my radar and in my short term folio for now. Got a stop set at 60 which is still 30% in a few days
Peace!
