Should you buy Axie Infinity or wait?Hello All. Looking at AXSUSD on the daily timeframe, we see that the price of axie infinity is trading inside a descending wedge/falling channel. This is a bearish pattern and is currently testing the resistance of the channel at $46.
It is important for AXSUSD to find support at this level or it can fall to the next support level which is at $37.
On the daily chart we are also forming a death cross, (50 Ema crossing below 200 Ema) which can push AXSUSD price as low as $20-$14. This is a 70% price drop.
Top of the channel line sits around $70, and if the price reaches this level, this will be a 50% profit from the current price.
This is possible with enough value coming in and since the stochastic rsi is in the oversold territory.
Although, it is less likely that AXSUSD will have a crash to $20-$14, everything is possible if BTCUSD and ETHUSD continue to drop further. (Check out my recent BTCUSD and ETHUSD chart for more information and levels of resistances to keep an eye for).
Thanks for reading, and stay tuned. Enjoy.
AXSUSD trade ideas

A Look at the Bigger Picture, has to go down before it goes upHello guys,
Today I am sharing a look at AXS on the weekly. A lot of folks have been paying attention to their favorite coins on lower time frames, failing to recognize that there is a pretty clear and definitive thing happening in the bigger picture.
As you can see on the price chart, I have 3 different trend channels stacked ontop of one another. Using this technique allows you to forecast resistance areas in the case a coin is reaching all time highs, or can also be used when coins are trading at their lowest prices.
So far, price has responded very well to these channels, and uses them as rigid support and resistance zones. Whenever price has tipped its way either above or below any of these lines with a candle close, it always goes to the next one at minimum.
Our last weekly candle closed below a channel, and now we are in the middle channel. With this, I am expecting price to trade lower, whether it is the next line, or a million lines lower (joking). What I am mainly looking for as a patient lion waiting to attack its prey, is, for price to be touching one of the trend lines, while the RSI is simultaneously touching one of its support lines.
With these two requisites paired together, I am pretty confident in being able to pinpoint our bottom for a huge buying spree before we haul on upwards. Of course, when these two requisites happen, it will be time to look for horizontal resistances as well as some looking on lower time frames to be able to make for a tighter stop loss.
My goal is to:
1. Wait patiently until I think it has bottomed by looking on this weekly chart, needing both Price AND the RSI to be on their trend channel support.
2. Look at horizontal resistances and pay attention to lower time frames.
3. Pull the buy trigger when I am able to make a setup that allows for a tight stop loss.
4. Watch this same weekly chart and plan to sell when Price AND RSI are both at their respective trend channel resistance lines. (NOTE: more trend channels may have to be stacked to this chart, but maybe not)
5. Celebrate!
I hope you guys found something useful from my post. Have a great night everyone, and as always, be sure to do your own due dilligence.


AXSUSD (Daily) Bearish wave We2Hi Traders
AXSUSD (Daily Timeframe)
A Medium probability, entry signal to go SHORT will be given with the downward break of 70.50 after the market found resistance at 84.04. Only the upward break of 84.04 would cancel the bearish scenario.
Trade details
Entry: 70.50
Stop loss: 84.04
Take profit 1: 54.74
Take profit 2: 36.18
Score: 5
Strategy: Bearish wave We2

AXSUSD within its Buy Zone flashing the same signal as JuneAxie Infinity has been on a long-term Fibonacci Channel Up ever since its first trading day in November 2020. As you see, it has two clear pressure zones, a Buy Band (green) and a Sell Band (red). Those have never failed to give clear buy/ sell signals.
What has been an even stronger buy signal though than AXSUSD trading within its Buy Zone alone, is that when it also breaks below the 1D MA200 (orange trend-line), it tends to bottom out and start a strong rally to the top of the Channel Up. That's what took place in late June 2021. With the Ichimoku Cloud also flashing a buy signal, AXS is possible to soon start a strong rally first towards $220.00 and then $500.00.
--------------------------------------------------------------------------------------------------------
** Please support this idea with your likes and comments, it is the best way to keep it relevant and support me. **
--------------------------------------------------------------------------------------------------------

AXS/PERP 12H TA decending channelAXS/PERP has been in this decending channelfor a while. we just arrived at a important accumulation zone.
a good moment to buy some AXS here imo.


AXIS ShortShorting AXIS here based on my engulfing candle strategy.
Stop is protective will update actions when taken.
EDIT - Price moved pretty quick got filled @ 71.519

$AXS - Still some more correction to goAfter peaking at 171.85, we are correcting the whole uptrend of $AXS since its creation.
I expect some more downside for the short term, taking us to the 50% - 61% pullback ($65 to $86).
The downtrend channel is well defined, and only a break of the channel would make me consider the correction is over.

AXS to infinityAnd beyond.
Solid fundamentals + tokenomics + technicals - AXS is one of the best swing trades in town rn.

Rally starting from here....Expecting a new bull rally on AXS. Price bounced off the 0.618 fibonacci

AXS bullishWell reset - rather pretty oversold technicals.
Raging fundamentals.
Huge user base & growing.
112% staking APR
Axie looks like a catch around these levels.

MY MINIMALIST CHART ANALYSIS FOR AXIE INFINITY
$AXS
12.02.21
0811H +8 SINGAPORE
Disclaimer:
The findings of the following analysis are the sole opinions of the publisher of this idea and should not be taken as a piece of investment advice.
ALERT:
LOOKING FOR BEST fo a SWING TRADE.
We are now looking at a NEW ENTRY POINT. Wherein the market has contracted significantly.
VITAL SIGNS: RSI, STOCH, and VOLUME are all looking good. We are waiting for accumulation and distribution and then the COILING of THE MARKET.
The previous SWING ended pretty well with amazing profitability.
The Market had amazingly moved along the TOPS and BOTTOMS of our BOXES, signifying TURNING POINTS of PRICE ACTION, together as predicting
certain major FIB Levels.
Hoping that this MINIMALIST BOX CHART ANALYSIS will efficiently help you with your DYOR as we climb this NEW SWING.
Happy Trading Everyone!
INSTRUCTIONS: HOW TO USE THIS MINIMALIST CHART
"FOLLOW THE WHITE RABBIT!"
Just Follow the TOPS and BOTTOMS of the BOXES as a GUIDE where the MARKET will take you.
Created on a MONTHLY, WEEKLY & DAILY Analysis of a MARKET'S CHARACTER.
It is designed for SWING TRADES at the BOTTOM. I do not SHORT, though, you can still use it.
TARGET ZONE IDENTIFICATION
The LARGE BOXES (Tops and Bottoms) are MAJOR turning points that will occur sometime in the future. While the SMALL BOXES (Tops and Bottoms) are MINOR turning points.
These can be entries to a BUY/ SELL POSITION, EXIT/PARTIAL EXIT/TOP-UP AREAS, as well as Support and resistance levels
Also includes MAXIMUM TARGET EXIT AREA OF VALUE - CONSERVATIVE (If price action conditions are right at that given moment.)
At times I include WAY BEYOND PARABOLIC Price TARGETS depending on The Character of the Market (CRYPTOS ONLY).
DYOR for your Volume, Chart Patterns, Candlestick Math, FIB COILS ( ABC ), Price Action, FIB LEVELS, Market Dynamics, especially institutional and retailer trading psychology.
NOTE: That PRICE TARGETS for ENTRY and EXITS are DYNAMIC and can CHANGE from time to time, depending on the dynamics of the market.
Wishing you all The Best Trades and Thank you all for your Appreciation and Support of My Work.
Much thanks to My 3 Mentors. They are so much of a Blessing that I also wish to share my knowledge.
Vive Le Autist!
Vive Le Egalitarian!

What about the future of axs?axs will definitely has an upward trend in the long run. But what to do today to buy?
I think someone is in a situation where we have to wait to reach a certain result fainaly axs has 2 way ------>
1.Maintain the current trend line and maintain the price of 102$ and move up to 116$ Break $ 116 and move towards long-term bullish targets.
2.Further correction to $ 82 and then up or In the worst case, break the number 82 and correct to the number 42
so in 2 way better is that Let's wait for the status of each of the scenarios to be determined because we are exactly right now We are in the middle of the road.

Is is time to BUY AXIE?Hey guys, this is Julie =D
Let's take a look on Axie Infinity today?
First let's talk about the weekly chart -
On the weekly chart, Axie is in a clear Bull Trend, it has made nice higher highs and higher lows, and now it is at a very good level: the price has just corrected to the 21 EMA, which is the same price it was in August (purple line), making a good resistance level.
(I would put the weekly chart image here, but I can't, sorry)
We don't have a confirmation yet, but it would be a great time to buy Axie, I would just wait for something like a Bullish Pivot on the daily chart.
Daily chart:
Have you noticed that Axie sometimes makes this rectangle and then blows up? I think this might be the case again.
Some people may also see a head and shoulders pattern in this last rectangle, but I think it is too big to be that. Also, Axie has done this before and it wasn't triggered, so I don't believe it is a head and shoulders pattern.
It also has this resistance (orange line) holding Axie at this level.
I'm out of Axie right now, but with a good confirmation, I would buy it. I would just wait to see if these resistance levels will not be lost.
Thanks for reading my analysis 🥰
If you liked this ideia, remember to support me with your like and subscription! 😊👍
Have a great weekend!

AXS is ready to go.The following content is machine translation:
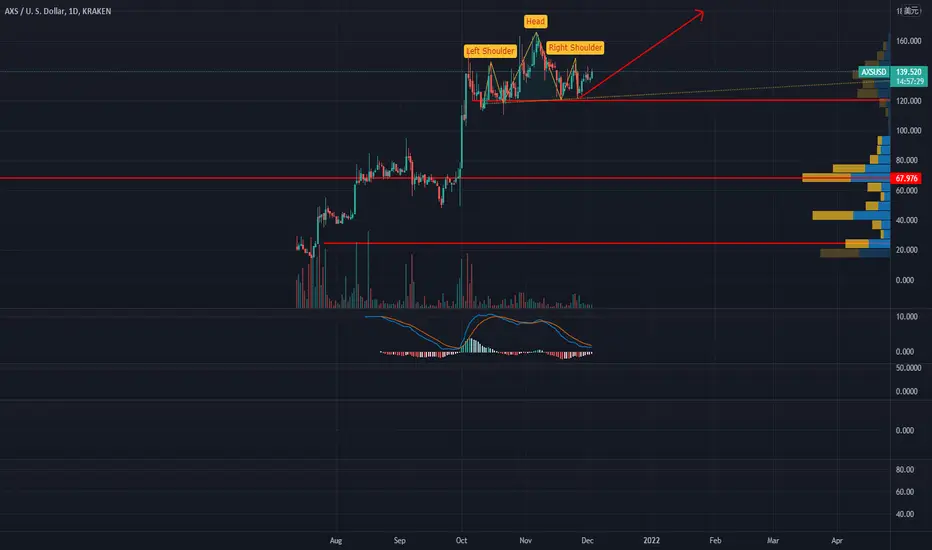
From the point of view of the distribution of chips, the chips are concentrated in 3 parts, the first stage is distributed around 20, the second stage is distributed around 65, and the third stage is distributed around 120. These three parts are the main concentration areas.
After several rounds of major corrections in the market, it can be stabilized above 120, which is an important support.
From the head-and-shoulders pattern, its neckline is also around 120.
The current Axy infinity side chain locked position amounted to 1.5 billion U.S. dollars, a record high. This is one of the factors conducive to promoting the market.
The current trend is showing signs of rising above 120, which is bullish.
The indicator macd is about to be a golden cross.
Operationally: do more, stop loss below 120.

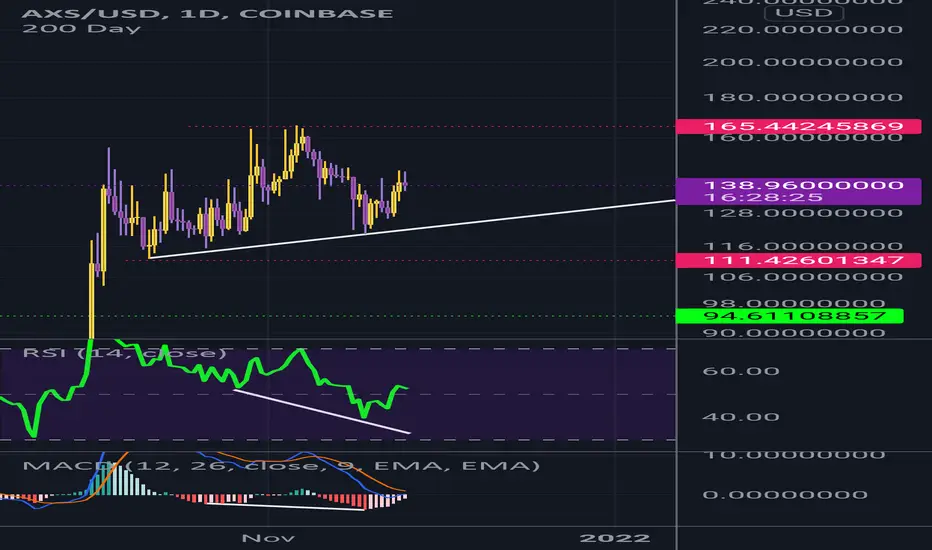
Axie bout to continue its movesHidden bullish divergence on the RSI and the MACD. No real pattern. No test of true support yet. Therefore, it is risky. The best bet for these gaming tokens is to wait for the price to come back down to test support.
4hr Bullish Engulfing Higher Low Above Bullish Shark PCZThe price and the RSI are attempting higher lows above the PCZ of a Bullish Shark and the 4 Hour is Bullishly Engulfing if price may attempt a breakout of the trendline after the closing of this Engulfing Candle and the RSI will attempt a rally above the 50 line.
My targets here will be the .786 and .886

AXS vs ETH: Blast-off? Zooming out, looks like AXS is ready to strengthen vs ETH again. Coupled with gaming/meta plays, feels like a natural trade...

AXS is climbing stairsThe trend of axs is very regular
It's like climbing stairs
Meta universe is the hottest concept recently
I believe he will continue to rise

AXSUSD H16: +200% gains BULLS THE BEST level TO BUY/HOLD(SL/TP)Why get subbed to me on Tradingview?
-TOP author on TradingView
-2000+ ideas published
-15+ years experience in markets
-Professional chart break downs
-Supply/Demand Zones
-TD9 counts / combo review
-Key S/R levels
-No junk on my charts
-Frequent updates
-Covering FX/crypto/US stocks
-before/after analysis
-24/7 uptime so constant updates
🎁Please hit the like button and
🎁Leave a comment to support our team!
AXSUSD H16: +200% gains BULLS THE BEST level TO BUY/HOLD(SL/TP)(NEW)
IMPORTANT NOTE: speculative setup. do your own
due dill. use STOP LOSS. don't overleverage.
READ ENTIRE IDEA BEFORE EXECUTION!
🔸 Summary and potential trade setup
::: AXSUSD H16/candle chart review
::: corrective cycle in progress no
::: spec accumulation / BUY DIPS setup
::: same structure MAY repeat soon
::: setup still valid as of RIGHT NOW
::: chart is LOG SCALE
::: get ready to BUY LOW later
::: currently/soon CORRECTION MODE
::: BUY LOW after 30% correction
::: entry - late Nov 2021
::: for now PULLBACK/CORRECTION MODE
::: on the right same a/b/c/d/e fractal
::: August/September fractal from the past
::: resulted in 300% gains off the low
::: re-test of range lows is likely
::: point d is BEAR TRAP (fake breakdown)
::: SPECULATIVE SETUP
::: do your own due dill
::: and use proper risk management
::: TP bulls is +200% gains
::: details: see chart
::: FINAL TP is +200% gains
::: recommended strategy: BUY/HOLD after correction
::: TP BULLS +200% gains 250 USD
::: SWING TRADE: BUY/HOLD IT
::: bull run not over yet
::: good luck traders!
::: BUY/HOLD and get paid. period.
🔸 Supply/Demand Zones
::: N/A
::: N/A
🔸 Other noteworthy technicals/fundies
::: TD9 /Combo update: N/A
::: Sentiment mid-term: BULLS/200% gains
::: Sentiment short-term: CORRECTION/MODE
RISK DISCLAIMER:
Trading Crypto, Futures , Forex, CFDs and Stocks involves a risk of loss.
Please consider carefully if such trading is appropriate for you.
Past performance is not indicative of future results.
Always limit your leverage and use tight stop loss.

AXS will soar!Meta!Meta!Meta!Yesterday we updated TLM, and then TLM rose sharply. Today we analyzed AXS.
Our team thinks AXS will be the next cryptocurrency to soar. Don't miss AXS!
If you think our analysis is good, please give us a praise!
buy zone: 120~130
SL:115
Target1:135
Target2:142
Target3:150
Good Luck!
