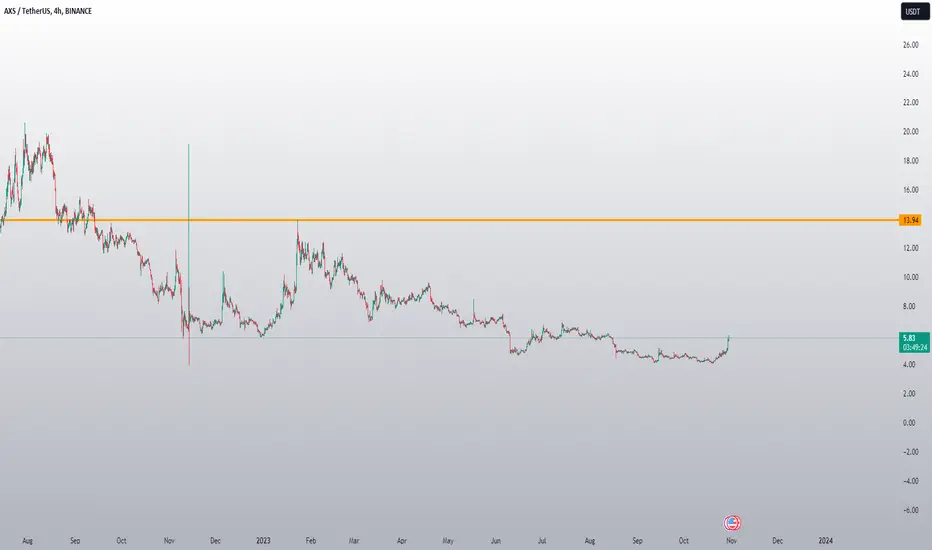
AXS: Resistance BreakoutAxie Infinity (AXS) technical analysis:
Trade setup : Following a bullish breakout from Channel Down pattern, price also broke above 200-day moving average, which confirmed a bullish trend reversal to an Uptrend. Now it’s broken above $7.00 resistance area, where it got recently rejected, and could revisit $9.50 next.
Trend : Uptrend across all time horizons (Short- Medium- and Long-Term).
Momentum is Bullish (MACD Line is above MACD Signal Line and RSI is above 55).
Support and Resistance : Nearest Support Zone is $6.00 (previous resistance), then $4.50. The nearest Resistance Zone is $7.00, which it broke, then $9.50.
AXSUSDT trade ideas


#AXSUSDT #LQR #TOBTC #LaqiraProtocolThe price is in a bullish channel. You can look for reasons to enter after confirming and matching the bitcoin levels in certain ranges. This analysis is a personal view and the offer is not buy or sell.

AXS LongI think bitcoin dominance will make a good increase as it declines. You have broken the downtrend and started a healthy uptrend, you are just at the beginning of the uptrend!

Critical Support and Resistance LevelAXS has successfully breached its descending trendline, indicating a notable bullish momentum.
However, it encountered resistance at a key supply zone, which curtailed its upward trajectory, redirecting the price action downwards.
Notably, a previously established resistance zone has been overcome and has now transformed into a support level. This transition suggests potential for an upward price movement. Nonetheless, if the price were to close below this pivotal area, it would likely precipitate a further decline towards the established demand zone, situated at approximately $5.5. This zone could act as a critical point for a potential bullish reversal, as market reactions at this level could fuel an upward price trajectory.
This analysis is for informational purposes only and should not be considered as financial advice.

AXS longAXS is bouncing off the support level which is alsi matching with the Fibonacci 0.5 retracement level. Bullish trend is expected to continue up to 7.2.


AXSTrading is a waiting game. Will wait which zone is going to break or respects before taking my plan.

AXS/USDT Bullish Trajectory from New Support Level? 👀 🚀AXS 💎 Paradisers, focus on #AXSUSDT as it demonstrates a notable trading pattern. Recently, resistance has turned into support, indicating a high probability of an upward movement.
💎 #AxieInfinity has shown a tendency to follow a descending channel, breaking above it to embark on an upward trend. Currently, it has broken above the resistance level of $6.61 with a strong green candle. If this breakout is successfully sustained, there's a significant chance for a bullish movement. With this continued upward momentum, AXS aims to target resistance at $9.51, and may even rise further to challenge higher resistance levels at $11.52.
💎 Additionally, for #AXS, be prepared for a potential bullish rebound from the support level of $5.25. However, be cautious as a fall below this level might signal difficulties in sustaining the bullish trend.
💎 In this dynamic and ever-changing market, strategic foresight and intelligent decision-making are paramount. Developing a comprehensive trading strategy, incorporating effective money management and a thorough understanding of support and resistance levels, is essential for achieving successful trading results.🌴💰


Axie Infinity Unveils NFT Monetization SolutionAxie Infinity (AXS), the widely-played blockchain game and metaverse project, has unveiled a novel initiative, allowing its non-fungible token (NFT) owners the commercial rights to produce and sell authorized merchandise.
This move by Axie Infinity represents a significant shift in the world of NFTs and their potential use cases, demonstrating the versatility and potential of NFTs to serve as digital assets that can be used in various ways, including generating passive income.
The initiative could inspire other companies and platforms to follow suit, leading to a more diverse and prosperous NFT market.
IMF bullish on Axie Infinity as whales amass AXS
A recent report from the International Monetary Fund (IMF) expresses optimism about three cryptocurrencies. The report anticipates positive performance from these projects by December 2023.
Axie Infinity functions as a platform enabling gamers to engage in diverse games and trade NFTs for potential profits. Despite a period of subpar performance in 2023, analysts project a recovery for AXS, surpassing $5 and reaching $7.30 by December.
On Oct. 25, there had also been an increase in development activity, maintaining a level unprecedented throughout the month and contributing to heightened investor confidence. The surge in value reflects the growing interest and engagement of investors in the Axie Infinity ecosystem, aligning with the broader trend of increased attention on NFT-based gaming platforms and their associated cryptocurrencies.
Continuing a trend from the previous day. This uptick in significant transactions has been notable since Oct. 27, coinciding with the asset’s sustained bullish performance.
At the time of writing, Axie Infinity is exchanging hands for $6.34, representing a 6.38% increase in the past 24 hours, according to data from CoinGecko.

AXSUSDT, a possible 300% rallyHello friends,
I hope you all had a wonderful Thanksgiving, and I want to express my gratitude for your support.
My next trade will be on AXSUSDT, and I am expecting the first rally to reach a target of $12-14 from the current market price of $6.35.
I predict that the next rally could go up to $20. My expectations are based on a couple of inverted H&S patterns that I have visualized.
Thank you.

#AXSUSDT (Watchlist) 10-2023AXSUSDT is a cryptocurrency that represents ownership of the AXS token, which is the native token of the Axie Infinity ecosystem. Axie Infinity is a play-to-earn game that allows players to collect, breed, and battle digital creatures called Axies.
Key features:
Play-to-earn: Axie Infinity players can earn AXS tokens by playing the game.
Non-fungible tokens (NFTs): Axies are NFTs, which means that they are unique and cannot be replaced.
Decentralized finance (DeFi): AXS tokens can be used to participate in DeFi applications on the Axie Infinity network.
Market cap: $672,357,101 USD (as of October 26, 2023)
Coin rank: #59 on CoinMarketCap
Coin supply: 141,312,223 AXS
Max supply: 270,000,000 AXS
Recent News:
Axie Infinity integrated with Cartesi to bring smart contracts to decentralized storage.
Axie Infinity announced a $100 million grant program to support decentralized storage development.
Axie Infinity integrated with The Graph to make data more accessible.
Add AXS to your watchlist
When we suggest adding a coin to your watchlist, it means it's forming a pattern or approaching a historical bottom, near or above a good support level, displaying increased trading volume, showing a reversal candle, in an accumulation stage, etc. However, we haven't seen any bullish reaction yet, so we recommend adding it to your watchlist until the right time for entry.
Note:
This isn't financial advice, but an analysis of coin movement (not a buy or sell signal). Before following any ideas, do your own research and practice good risk management.
Remember, the cryptocurrency market is highly volatile and involves both gains and losses. Understand the risks before investing.
Good luck to everyone, and we hope that Allah reconciles and repays us all. 🙏

AXS When no one remember, it will come back and wow everyoneIt seems ppl forgot AXS and its leadership iconic in Gamefi!!!
Well, it will come back to as high as $70!!!
I expect to see $70 in 2-3 months timeframe!

Axs 3d is bullish since. So. Axs is ultra Bullish since it is above the white area
It made
. Shark pattern
. Falling wedge with breakout
. Breakout of a major previous bottom
. Choch of previous top
It may go even much higher in the upcoming bull run next year insha Allah
All the best insha Allah!

AXSUSDT"As we enter the bullish season, the initial target to aim for is
target : 90 🎯.
This is based on a combination of technical analysis indicators and market trends.
However, it's important to approach trading with caution and adapt to changing market
conditions.
Keep an eye on key support and resistance levels, as well as any significant news or events that may impact the market.
Remember to use proper risk management techniques and consider setting profit targets along the way.
Happy trading!"

$AXS looking for next leg NYSE:AXS is stabalizing after being in a downtrend for a long time. On my 3D chart i have the downtrend drawn. Looking at the big liquidity candle of nov 12 you can draw a bottom and based upon off that data it bounces of the levels of 3.99.
Also NYSE:AXS has formed a pretty double bottom after a ugly liquidity wick there. Normally you would see those candles filled up properly.
I would like to see where AXS goes in the next coming weeks because also liquidity is building up and is going to play out somewhere in the near future.

AXS looking strong but close over 6 is a mustBullish AXS broke trendline and now it's facing resistance at Kumo 1D. 3D still has some room to play before eventual retracement but once 6 is becoming support, the next target is in play.
Close over TP1 is a must.

Order block, inducement and RTO As usually, I saw a point of Interest an Order-Block with an inducement, I'm waiting for the return to order and sell down to collect liquidity

$AXS Right angled Broadening bottomLooking at this inflection above 5.76 as the critical level here. We want to see a break thru that level and a checkback to confirm the S/R flip.
In the context of a right angled and descending broadening formation, you would eventually expect a return to the range highs and a consolidation below it which ultimately gives you a partial decline. This is confirmed when price returns to the highs, and greatly favors a breakout there after.
The measured move would bring you into the 786, as high as 89$ but id personally follow the levels and where price correlates too historically. 11, 18, 23, 44, 78, all good levels for partial exits for an active trader.
Im not predicting price will reach any of these levels, but if the operator is indeed in a mark up phase here, these are the levels he will visit on the way up.

#AXSUSDT #LQR #TOBTC #LaqiraProtocolThe price is reversing after breaking the resistance zone of $5 you can open a trade after getting confirmation with your strategy and matching Bitcoin levels in certain limits. This analysis is a personal view and the offer is not buy or sell

AXS VOLUME WHALE INCREASEThank you for reading our update. Please remember that this is not advice for trading.
AXS Looks to have a new uptrend volume
Can have the same effect as TRB shows before.
AXS is known from 27-07-2021 when it was able to gain from this price action to up $160
And still, there is a list of building whales that holding it.