Possible risegood order block with good imbalance is spotted, a 3 push with RSI divergence is seen. If price comes in to the order block and forms a choch in 4hour time frame, then we can be hopeful to a rise.
Remember this is a position that was found by me and it is a personal idea not a financial advice, you are responsible for your loss and gain.
AXSUSDT trade ideas


Buying axs hereRsi showing over sold on four and one hour time frame but if it reaches the blue zone which isthe demand zone am going to long it fully.

AXSUSDTHello Traders,
As we can see that after a long bearish move AXS comes to support now we can expect a bullish move from here, we can take a long position here.


AXS CAN CLIMB UP TO 600%Hi, dear traders. how are you ? Today we have a viewpoint to BUY/LONG the AXS symbol.
We have already analyzed AXS. Given that our diametric is forming with a gentler slope, the green range for AXS is expected to be a trend changer.
For risk management, please don't forget stop loss and capital management
When we reach the first target, save some profit and then change the stop to entry
Comment if you have any questions
Thank You
#AXS/USDT - Long - Potential 4.82%Direction: Long
Market: Spot
Risk: 0.25% - 1%
#USDT_AXS
Exchange: BINANCE
Timeframe: 360
TP1: 6.31
Entry: 6.02
STOP: 5.73
Entry Conditions:
| Bullflag break
| 20MA break

#AXSIt is moving in a downward diagonal triangle, and if it does not stabilize above 6.25, this downward trend will continue.

AXSUSD ❕ tests the supportPrice and RSI chart formed a convergence on 4H TF.
AXS has fixed above 50EMA on 4H TF.
I believe the asset will continue to rebound.
Axie Infinity longAxie Infinity broke trough the resistance level. Asset broke trough the descending trendline. Bullish movement to resistance level at 6.56 is possible.

AXSUUSDTHello Traders,
As we can see the chart of AXSUSDT it has broken the support and also retested succesfully we can open a short position here, follow chart pattrn to open a position.

AXS/USDT upward momentum? 👀🚀 AXS today analysis💎It's currently maneuvering around a pivotal support level, echoing a familiar fractal structure.
💎 A few days back, AXSUSDT skillfully formed equal highs, subsequently embarking on a downward trajectory. This move was accentuated by a liquidity sweep and a transformation from demand to supply.
💎 Presently, with the recurrence of a similar fractal pattern, we anticipate AXSUSDT to embrace a bullish trajectory, mirroring its previous actions at this level.
💎 In the dynamic world of crypto, staying informed and adaptable is key. Stay tuned for more updates and enjoy your trading journey

AXS and the 2024 Risk to reward Potential opportunity Hi Everyone;
today we have one of the best risk to reward Investment opportunity
it is more than 2024 times the risk and the chart is look very promising.
I expect breaking the previous bear market key point will clear the way to the final target

Indecision position | Up or DownWeekly Chart
Axie Infinity BINANCE:AXSUSDT is in indecision position around 6
It's under descending trend line and have a support at 5.7
Daily Chart
AXS's in uptrend and rejected level 6 some times. So I think it'll retest the resistance around 6.4
Just wait

AXS target 12.8~13.912h time frame
-
AXS broke that falling wedge and creating a small wedge so far
Current wedge get broken out would be a better entry to uptrend continuation
TP: 12.8~13.9, 16.46, 19.69
SL: 4.43
*If price reach 15.1~16.4, adjust SL up to 12.86

Axie Infinity (AXS): A Universe of Digital PotentialAxie Infinity, a creation of the Vietnamese studio Sky Mavis, operates within the realm of non-fungible tokens (NFTs). The game revolves around digital entities known as Axies, which share certain resemblances with Pokémon. Players nurture these Axies as virtual pets, focusing on various aspects like battling, breeding, collecting, raising, and establishing kingdoms. The game offers an in-game economy where players can monetize their efforts through selling items (Axies they breed, virtual real estate, accessories, etc.) via the game’s NFT marketplace and also acquire tokens.
While my analysis is founded on an objective standpoint, I must admit I hold a personal bullish bias towards Gamefi cryptocurrencies, with Axie Infinity (AXS) being the catalyst that ignited my interest in the crypto ecosystem.
My initial investment journey with AXS started on the Binance platform and later transitioned to OKX mid of the previous year. AXS was launched in November 2020 on Binance, whereas its listing on OKX occurred later in July 2021.
Historical Price Analysis
Binance Era:
Launch: AXS opened at $0.50 on Binance on November 20th, 2020, during BTC's '20 bull run. A subsequent 14% drop in BTC led to a 35% dip in AXS, forming a major support at $0.37. A sharp recovery of 125+% occurred in the next 22 days.
Early 2021 Rallies: Breaking the previous rally's high on January 26th, 2021, AXS achieved an impressive 60% gain in 11 days, creating another crucial support at $1.345.
Bull Run Impact: From February 26th to July 28th, 2021, AXS skyrocketed 3275% in conjunction with the broader crypto bull run.
OKX Integration:
Resistance & Support: Upon AXS's OKX debut, resistance at $45.50 and support at $37.50 were established.
All-Time High: Amidst hype and economic concerns, AXS reached its all-time high (ATH) of $165.67.
Current Market Position
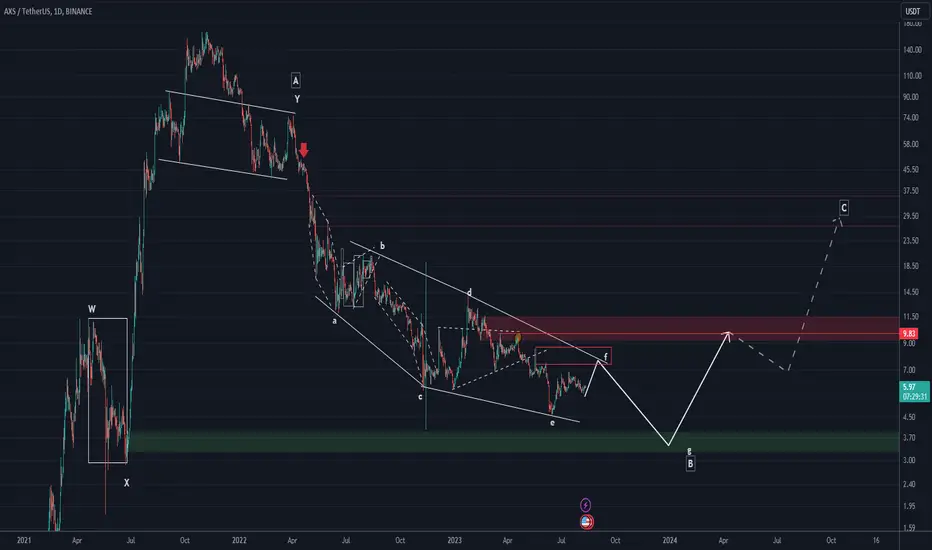
Downtrend: Since November 25th, 2021, AXS has faced a bearish downtrend with an Area of Interest (AOI) ranging from $115-102. The break of major support at $91.85 without substantial buyer intervention led to a sell-off, reaching the current support at $5.96.
Significant Support Level: The $5.96 support level has seen major rallies (November 10th, 2022, and December 31st, 2022) and a significant 17% drop on June 10th, 2023. A recovery above this support level indicates weakness as the price revisits this area.
Where Do We Stand?
Trends & Indicators: Observing the major downtrend since early May 2022, with three significant attempts to break, and considering the 50 and 200 EMAs (Exponential Moving Averages), the 50 is acting as resistance.
Bullish Signals: The first bullish signal created by ROBO at $5.885 remains intact, suggesting that shorting is not advisable despite potentially bearish signs.
What's Next?
Potential Downside: If AXS fails to sustain above $5.96, a downward movement could occur towards two significant areas highlighted for mid-short term perspectives.
Potential Upside: Should the price hold above $5.96 and challenge the AOI or attempt to break the current downtrend, a psychological shift could lead to a potential rally.
Patience: This coin will require careful observation and patience as the market dynamics unfold.
Conclusion
Axie Infinity (AXS) represents an engaging and complex intersection of gaming, blockchain, and digital economy. Its journey showcases the volatility and potential within the GameFi space. The coming months may reveal whether AXS can capitalize on its support levels or succumb to bearish pressures. As always in crypto, vigilance and strategic insight will be paramount for traders and investors navigating this dynamic landscape.

Keep an eye on $AXS/USDTDid you find this crypto market analysis helpful? Stay updated about the latest crypto market update.
Please continue to follow my analysis and feel free to ask any queries, you may have. I am here to assist you.
TradingView: @FarmanBangashh

AXSUSDTHello Traders,
AXS broke the upper resistance now it comes into the channel and we expect that it will show bullish movement from here to the upper resistence as per the chart

AXSUSDTBINANCE:AXSUSDT has been in a downtrend since late January, each time meeting resistance from the downtrend line marked on the chart and pushing the price lower.
However, we are now seeing the price stabilize and the downtrend line break. The price trend has changed from down to up, which can be confirmed with higher pivots.
I try to wait for a retest after the trend lines break or find a complete confirmation of the end of the previous trend. In this case, we can wait for the price to test $6 again or wait for the upper resistance to break, which is marked with a red box on the chart.
However, in general, we should expect the start of an uptrend at least up to 9.5 USDT.
The overall trend is expected to be bullish.
⚠️ "Daily crypto market analyses I provide are personal opinions & not financial advice. Trading carries risks, so do your own research & seek advisor's help."
Don't forget to like and comment

#axs shortshort axs we can see a clear breakout of axs toward downward, we can expect a 10% dump from here.

AXS BULLS TO TAKE OVERHello Traders and everyone, I am Hadi Karaali, Known as SNIPERS_FX
If you like the idea, do not forget to support with a like and follow.
AXS FROM A MEDIUM-TERM PERSPECTIVE
As we can see price is sitting around a strong support zone.
Where we will be looking for new longs.
However, for the bulls to kick in from a medium-term perspective, we need a break above the marked major swing high.
Then a movement higher would be expected.
Until that price can still dive more lower before reversal.
If you like this kind of analysis don't forget to like and follow
and as usual follow your trading plan and manage your risk.
Be patient and good luck!

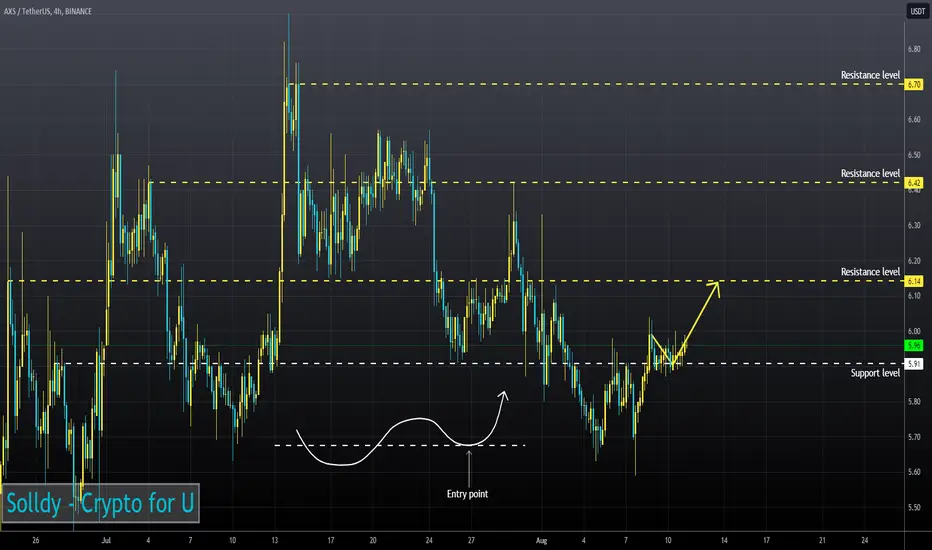
AXSUSDT needs the breakout!AXSUSDT, as of the current analysis in the 4-hour timeframe, the price movement has been confined within an ascending channel, indicating a bullish trend. The ascending channel is formed by drawing two parallel trendlines that connect the higher lows and higher highs of the price action.
At this particular moment, the market is approaching a significant level of resistance on the daily chart. This daily resistance has previously acted as a barrier for the price to move higher. Traders and investors are now closely observing the price action as it tests this crucial level.
According to Plancton's rules, a respected and widely-followed trading strategy, a new long (buy) position is suggested if the price successfully breaks out above $6.60. A breakout above this level would indicate a potential continuation of the upward trend and could lead to further price appreciation for AXS/USDT.
It is essential for traders to exercise caution and wait for the breakout confirmation before entering a long position. Breakouts can be volatile, and false breakouts are not uncommon. As such, it is advisable to wait for a clear and sustained movement above $6.60 with significant trading volume to confirm the breakout's strength.
–––––
Follow the Shrimp 🦐
Keep in mind.
🟣 Purple structure -> Monthly structure.
🔴 Red structure -> Weekly structure.
🔵 Blue structure -> Daily structure.
🟡 Yellow structure -> 4h structure.
⚫️ Black structure -> <= 1h structure.
Follow the Shrimp 🦐

AXS/USDT Could See a Potential 30% Drop in the Next 25 DaysIn the volatile world of cryptocurrency, market fluctuations can often lead to both exciting opportunities and significant risks. One such case is AXS/USDT, a popular trading pair that is now drawing attention due to predictions of a potential 30% decline within the next 25 days.
One contributing factor to the potential 30% drop in the value of AXS/USDT in the next 25 days is the increase in token circulation. Recently, an additional 1.63% of AXS tokens have been introduced into the market. This sudden influx of tokens could create an imbalance between the supply and demand dynamics, potentially leading to downward pressure on the token's price.
When a substantial number of new tokens are introduced into the circulating supply, it can dilute the value of existing tokens, causing their prices to decline. Investors may become wary of this increased token supply, leading to a decrease in demand and subsequent price depreciation.
Moreover, the fact that the price has previously experienced a 30% drop further amplifies concerns about potential future declines. Market participants tend to closely monitor historical price movements and patterns to gauge potential future price actions. If a particular asset has shown significant price volatility in the past, investors may become more cautious and hesitant, which could trigger selling pressure and further contribute to the price decline.
Combined, the increase in token circulation and the past precedent of a significant price drop create a scenario of heightened uncertainty and apprehension in the market. Investors may exercise caution or adopt more conservative trading strategies to safeguard their capital from potential losses.
As always, it is crucial for traders and investors to stay informed about the latest developments, perform thorough analyses, and assess risk factors before making any investment decisions in the cryptocurrency market. With the rapidly evolving nature of digital assets, being prepared and proactive in response to market dynamics is vital to navigate the complex world of cryptocurrencies successfully.
