AXS___ ONLY UP 10$ Support The #AXS And The Price Exactly Bounce From That Point ,Currently I Expect a One More Move To The 11.40$ Resistance And Breakout From This Level ,12.5$ And 14$ My Next Targets In a Short Term
AXSUSDT trade ideas

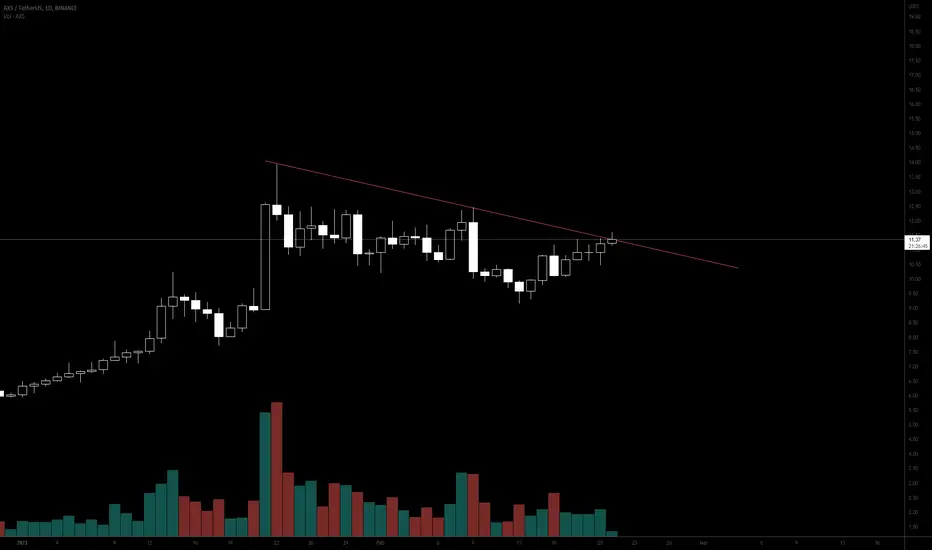
AXS USDTFinally, the uptrend line of AXS was broken and it is currently in a falling channel. It is below the 200 EMA in the 4-hour time frame. If we believe in the downward trend of the market, the scenario in front of us will be the most likely scenario.

AXS's price reacted to the resistance rangeAXS's price reacted to the resistance range of $11.78 to $12.50 after successive collisions.
The resistance for which it is intended is the range, the breaking of which could change the trend in the daily time frame from range to bullish.
But the solid negative reaction observed to this level has caused the movement to range between this resistance and support from $8.40 to $9.40. Also, the 50% retracement Fibonacci retracement was just within the designated support area, reinforcing this level.
So as long as this range is maintained, there is potential for further growth and breaking the resistance ahead. Also, in case of breaking and continuing the upward trend, higher targets range from 18.5 to 20 dollars.


#AXS - Axsi infinity Daily charthi.... Now on Daily chart Axie Infinity #AXS trying to break the downtrend.
Worth following. The daily closing above the trend after the breakout makes it a good opportunity to enter good luck for all.

AXS/USDT | Pretty Solid Descending Channel Consolidation..!!
#AXS Looks Promising here 🔥
Pretty Solid Consolidation in Descending Channel, Seems like Bottomed out & Ready to Fly.
In Case of Breakout, Expecting +400% Bullish Rally in the Midterm..🏄♂️
It's important to maintain a Disciplined and Patient approach to investing in order to achieve Long term Success.
Please like the idea for Support & Subscribe for More ideas like this and share your ideas and charts in Comments Section..!!
Thanks for Your Love & Support..!!

Intersection of Trading and Gaming: The Rise of Play-to-EarnHello traders (and gamers),
Trading is an industry that has been through significant change over the last few years as a result of the emergence of new technology and techniques that have shaken up the market.
The convergence of trading and gaming, which has resulted in the proliferation of play-to-earn platforms, is one of the most fascinating movements now taking place.
Play-to-earn platforms are online gaming environments that enable users to earn real money by participating in a variety of in-game activities.
Play-to-earn platforms may be found on the internet.
These pursuits may include anything from the purchase and sale of virtual products to the completion of in-game chores and challenges.
Play-to-earn platforms, in their most basic form, combine the thrill of gaming with the opportunity for cash gains associated with trading.
The development of blockchain technology has been a major driving force behind the proliferation of play-to earn platforms.
This is because blockchain makes it possible to generate virtual assets that players can own and exchange with one another.
Game creators may establish decentralized platforms where players can buy, sell, and trade virtual assets in a safe and transparent manner by utilizing blockchain technology.
These platforms can allow players to purchase, sell, and trade virtual goods.
Axie Infinity, a blockchain-based game that enables users to gather, breed, and combat creatures called Axies, is one of the most well-known play-to-earn platforms.
Players may earn cryptocurrency by participating in the game.
Axies are one-of-a-kind digital assets that may be purchased, resold, or exchanged on a variety of different online markets.
By accomplishing a variety of in-game objectives, players have the opportunity to accumulate in-game tokens, which may later be traded in for "real money."
Players from all over the globe are coming to Axie Infinity in order to make money and have fun while playing the game.
Axie Infinity has become a worldwide phenomenon.
The popularity of the game has resulted in the proliferation of a new crop of play-to-earn websites, the majority of which are also based on blockchain technology.
Play-to-win platforms have opened up fascinating new doors of opportunity for traders as well as gamers, but users should be aware that these platforms are not risk-free.
Participants have a responsibility to exercise caution in order to avoid falling victim to cons and other fraudulent schemes, as well as the volatile nature of virtual assets.
Play-to-earn platforms, on the other hand, provide a one-of-a-kind opportunity for users who are prepared to do the necessary research and accept some degree of uncertainty in order to make money while still having fun.
To summarise, the merging of the worlds of business and entertainment has opened up a whole new swath of potential revenue streams for those who are game to investigate them.
Play-to-earn platforms are an exciting new trend that have the potential to alter the way that we think about gaming as well as trading.
Play-to-earn platforms combine the elements of gambling and trading.
Those who are willing to put themselves out there and attempt new things will have a bright future thanks to the ongoing development of blockchain technology, which will likely result in the emergence of even more ground-breaking applications, services, and experiences.
The more hyped a game is, the more people talk about it and want to trade the underlying crypto coin.
Crypto trading is inherently social
That's why I monitor the different trends using Google Trend and other screeners to figure out which games people are actively playing.
This is part of my fundamental analysis when looking for crypto gaming coins to trade
I'm mindful that Bitcoin is the tide that lifts all the boats - meaning if Bitcoin doesn't pump first, the altcoins - including the gaming coins - won't move much
Thank you for reading

AXS WILL SURPRISE MANY OF YOU 👉 Bull Flag Formed At The AXS Chart And Also ABC Corrective Pattern Completed ,I Expect a Breakout From a Trend Line And New Bull Run Will Start Soon ,12.5$ ,14$ And 17$ Are Next Targets

AXS LONG TERM BULLISH REVERSALHello Traders and everyone, I am Hadi Karaali, Known as SNIPERS_FX
If you like the idea, do not forget to support with a like and follow.
ZOOMED OUT PICTURE ON AXS
As we clearly see price is still overall bearish Making clean lower lows and lower highs
However, AXS is around a strong round number where we will be looking for new longs as well.
And for the bulls to kick in from a long-term perspective we need a break above the marked major swing high
Then a further movement higher would be expected
Until that we are still overall bearish, and we can still dive one more time before reversal
If you like this kind of analysis don't forget to like and follow
and as usual follow your trading plan and manage your risk.
Be patient and good luck!

AXS long position Long on AXS/usdt
Entry: 9.94
Profit 1: 10.42
Profit 2: 10.81
Profit 3: 11.19
Stop loss: 9.16
Btc determines the market trend, trade with caution.

Possible $AXS BounceWe have a possible bounce action here as $AXS retests its previous resistance now turned support. It also coincides with S/R flip on the RSI trendline.

AXS/USDT on a weekly Hey, guys ✌️
Last one for today is going to be AXS/USDT pair. The weekly 20 EMA has been broken, and we expect the price to reach the neckline zone. When we arrive, we will reopen the chart and determine which direction is best to move in.
If you like ideas provided by our team you can show us your support by liking and commenting.
Yours Sincerely,
Swallow Team 🔱
Disclamer:
We are not financial advisors. The content that we share on this website are for educational purposes and are our own personal opinions.

AXSUSDT LONG SIGNALSHi, friends. Nice to meet you.
You're all having fun trading, aren't
AXS is currently located in the sales section and believes it will rise soon.

SELLING AXS/USDTi will take a short/sell position on AXS/USDT
50% of position at 11.50
TAKE PROFIT 11.3
STOP LOSS at 11.81
50% of position at 11.70
STOP LOSS at 11.81
TAKE PROFIT 11.3
FOLLOW FOR MORE

AXSUSDTI see a Bull Flag breakout forming in the Daily chart of AXSUSDT.
Bull flags are usually a continuation pattern but I'm waiting on next daily candle close above the resistance to confirm the bullish breakout.
The volume is increasing with it so it's possible to continue the bull trend it started.
Both my take profits are shown which are major resistance zones.

$AXS - Short Trade Set-Up$AXS - Short Trade Set-Up
Entry Conditions:
- Double Top Rejection from strong resistance
- Breakdown from consolidation
- Bearish Divergence
- Impulse Signal

AXS LONG SETUPHi, dear traders. how are you ? Today we have a viewpoint to BUY/LONG the AXS symbol.
For risk management, please don't forget stop loss and capital management
When we reach the first target, save some profit and then change the stop to entry
Comment if you have any questions
Thank You

AXSUSDT is inside a bullflagAXSUSDT is inside the bull flag
A bullflag is a chart pattern that occurs in an upward trending market and is characterized by a period of consolidation or retracement within a parallel channel, creating a flag-like shape. The pattern is considered bullish as it often precedes a continuation of the uptrend.
In this case, AXSUSDT is testing the 0.618 Fibonacci level inside a bullflag formation.
The price has increased 63% since the previous idea after a clear breakout from a descending channel. Additionally, the price created an engulfing pattern on the daily support at the 10$ area, which could be a bullish signal, so According to Plancton's strategy , we can set a nice order
–––––
Keep in mind.
🟣 Purple structure -> Monthly structure.
🔴 Red structure -> Weekly structure.
🔵 Blue structure -> Daily structure.
🟡 Yellow structure -> 4h structure.
⚫️ black structure -> <= 1h structure.
–––––
Follow the Shrimp 🦐

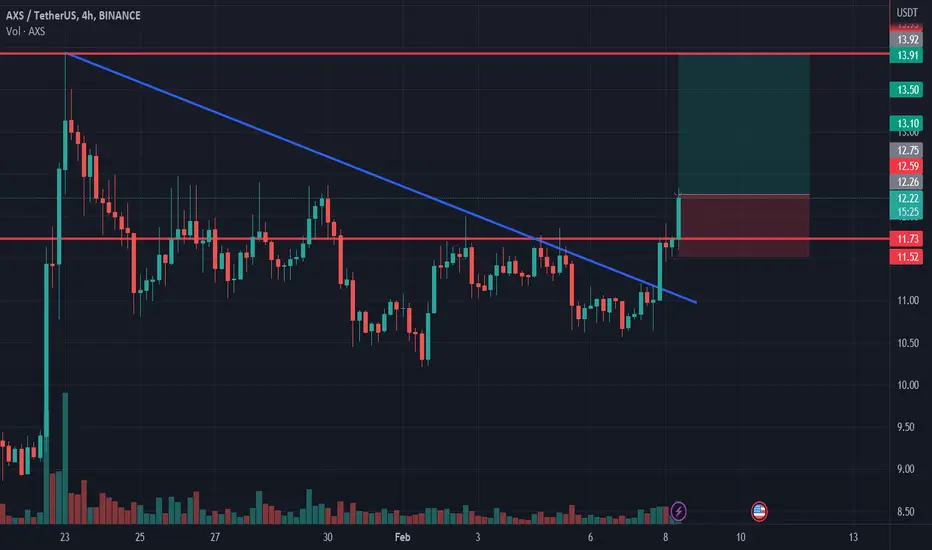
AXS longAXS broke trough the descending trendline. Asset broke trough the resistance level. Bullish movement to resistance level at 13.9 is expected to happen.
AXSUSDT | SYMMETRICAL TRIANGLE BREAKOUTAXS after breakout has been trading in a bullish trend .
The price has been converged and trading above the triangle.
Now bulls need to hold the breakout zone.
Manage your trades accordingly.


Bullish SetupDescending Channel Is a Main Pattern Formed At The AXS Chart And I Expect a Breakout From a Trend Line In Near Future ,11$ Is My Buy Zone And 13.1$ Is a Target In Short Term
