AXSUSDT trade ideas


AXIE INFINITY long position 🚀As I mentioned in my previous analysis ✔️
the price has broken the descending channel to the upside and almost hit the first target 💣🐋💣
and now we expect more gain 🚀
and
our other important resistance area located on the chart ✔️
if
the price breaks the upper resistances, we will see more gain 🚀🚀
before more gain, we can expect brief correction to the downside ❌🧨
Please, feel free to ask your question, write it in the comments below, and I will answer.🐋

Bulls Incentive For AXS Token Finally, is $100 Define Next move?The Axie Infinity Token has reversed its declining trend and started rising higher, seeing a nearly 44% spike this week.
Axie Infinity Token interpreted the 100-day moving average line yesterday and is consolidating to reach the 200-EMA.
The SuperTrend indicator gave a bullish sign last night over the daily price chart.
Axie Infinity Token price is being seen above the 20- and 50-day EMAs, as well as recently, holders pushed costs above the 100-EMA (Yellow) last night. Besides, the 200-EMA is forming a bullish barrier.
The RSI is moving towards an overbought zone in terms of the daily price chart. While the RSI is at 72-point, it indicates stability in the bullish momentum as long as the price action does not show any bearish signs.
Axie Infinity holders have a chance to achieve their goals once again. Following the sharp rise, the coin could pull back and the 100-EMA could act as a support zone for long-term investors of the AXS token.
Support level - $45 and $35
Resistance level - $90 and $115

Axie Infinity , Buy or wait ❔❕🔖One of the most popular coins among gamers axie infinity after its price explosion and amazing climb in recent months. Now, like the rest of the market, it has entered a correction phase and has dropped to $ 45
📌 It has now reached its important bullish support area
It is also fluctuating near downtrend line
The price is expected to break the trend line around $45-50 and move to $70-80.
💎 We have to see if Bitcoin can maintain 40k level given the current situation
axie I think can start its upward movement
➖➖➖➖➖➖
All supports and resistances are marked on the chart. As we can see, the price is in an important range and recommended to keep an eye on it ...
Follow our other analysis & Feel free to ask any questions you have, we are here to help .
⚠️ This Analysis will be updated ...
📊 #AXSUSDT ( Axie Infinity )
💹 Time Frame : Daily
🔵 Personal Opinion : Long
🎯 Next Targets : $66 — $72 - $83
👤 Saeid.Mahbob
📅 3.Mar.22
❤️ If you apperciate my work , Please like and comment , It Keeps me motivated to do better ❤️

AXS Short scenarios UPDATEI'm looking for a swing fail of the previous high at 72$, or if it wants to go higher the next level I'm looking at is at 84$.
Will short it as soon as I see a clear rejection.


AXS Short scenarioLooking out for a swingfail on previous highs, it's already printing above it.
As soon as it's a clear swingfail and we drop back below I'm shorting

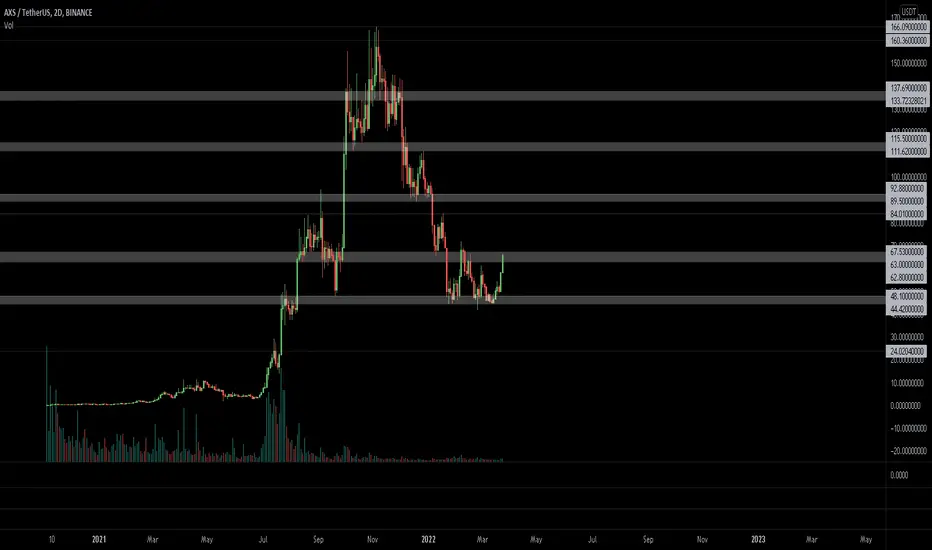
AXSUSDT - Weekly Technical Analysis UpdateMidterm forecast:
While the price is above the support 37.6000, beginning of uptrend is expected.
We make sure when the resistance at 91.0875 breaks.
If the support at 37.6000 is broken, the short-term forecast -beginning of uptrend- will be invalid.
Technical analysis:
There is a divergence in RSI and price between the trough at 44.42 on 2022-01-24 and the trough at 41.9 on 2022-02-24, the probability of downtrend continuation is decreased and the probability of beginning of uptrend is increased.
The RSI resistance #1 at 51 is broken, so the probability of beginning of uptrend is increased.
A trough is formed in daily chart at 41.9000 on 02/24/2022, so more gains to resistance(s) 65.1427, 83.0000 and maximum to Major Resistance (91.0875) is expected.
Price is above WEMA21, if price drops more, this line can act as dynamic support against more losses.
Relative strength index ( RSI ) is 68.
Take Profits:
65.1427
83.0000
91.0875
111.6055
120.4969
138.8161
166.1540
220.0000
❤️ If you find this helpful and want more FREE forecasts in TradingView
. . . . . Please show your support back,
. . . . . . . . Hit the 👍 LIKE button,
. . . . . . . . . . Drop some feedback below in the comment!
❤️ Your support is very much 🙏 appreciated!❤️
💎 Want us to help you become a better Forex / Crypto trader?
Now, It's your turn!
Be sure to leave a comment; let us know how you see this opportunity and forecast.
Trade well, ❤️
ForecastCity English Support Team ❤️

🔥 AXS Ready To Fly: Strong Reversal IncomingAXS has been trading in a very steep bullish channel for over a year. However, during the most recent bearish move AXS was heavily shorted and sold off from $165 to $42, making it one of the biggest losers of the last few months.
However, when the fall is steep, there's a high probability that the rise will be steep as well. Over the last week, AXS has been gaining around +35% and is shaping up to be one of the winners of the current week. I'm eyeballing the $100 resistance for the coming 2-3 weeks as a potential target.
If things keep on being bullish, we might be looking at a new all-time high in the coming months, potentially end of summer.
Happy trading!

AXSUSDT - Weekly Technical Analysis UpdateMidterm forecast:
While the price is above the support 37.6000, beginning of uptrend is expected.
We make sure when the resistance at 91.0875 breaks.
If the support at 37.6000 is broken, the short-term forecast -beginning of uptrend- will be invalid.
Technical analysis:
There is a divergence in RSI and price between the trough at 44.42 on 2022-01-24 and the trough at 41.9 on 2022-02-24, the probability of downtrend continuation is decreased and the probability of beginning of uptrend is increased.
The RSI resistance #1 at 51 is broken, so the probability of beginning of uptrend is increased.
A trough is formed in daily chart at 41.9000 on 02/24/2022, so more gains to resistance(s) 65.1427, 83.0000 and maximum to Major Resistance (91.0875) is expected.
Price is above WEMA21, if price drops more, this line can act as dynamic support against more losses.
Relative strength index (RSI) is 68.
Take Profits:
65.1427
83.0000
91.0875
111.6055
120.4969
138.8161
166.1540
220.0000
❤️ If you find this helpful and want more FREE forecasts in TradingView
. . . . . Please show your support back,
. . . . . . . . Hit the 👍 LIKE button,
. . . . . . . . . . Drop some feedback below in the comment!
❤️ Your support is very much 🙏 appreciated!❤️
💎 Want us to help you become a better Forex / Crypto trader?
Now, It's your turn!
Be sure to leave a comment; let us know how you see this opportunity and forecast.
Trade well, ❤️
ForecastCity English Support Team ❤️

$AXS, 30% over the last 48hs$AXS
If BAYC is the blue chip of the NFT, then AXS is the blue chip of the crypto-games?
30% over the last 48hs & showing a new UCTS 2D Buy signal (has to close)
Volume making HHs. If manages to hodl/flip this area, then aiming for ~90$
#AXS
AXS 48% setupAXS found bottom, we can see some like Adam and Eve pattern with growing RSI. I'll try to open position near 0.618 fib and MA100 on daily timeframe.

Axie Infinity (AXSUSDT) mid tf Range Updated till 24-3-22Axie Infinity (AXSUSDT) midteir timeframe range. this is a fundamentally beast of an alt for its virtual use-case and active development. but i am here to talk about some Technical sides here. its got pretty decent price action cause of volume of course. it got swing setups, intraday setups, there are some scalp setups too but risk is kinda little bit higher than leveraged profit. there are not much of space between its zones its been occupied for the scalps and microtrades.

AXSUSDT 1D TA : Break TredLineBy supporting the price in an important support range, it was able to break the downtrend line. If we re-support and break the next trend line in the chart, we have a chance to climb to the specified goals. Otherwise we will have a reaction on the trend line.
Its not Buy or Sell SIGNAL
DYOR
BY : Mohamad Teriz - @AtonicShark

AXS / USDTwe try to provide analyzes with a specific time area
Please note the expiration time.
always Be faithful to the SL.
*(( If you make an emotional decision, do not use any analysis. Try to control your emotions and manage your asset ))*

AXS short ideaAXs looks too oversold and it is showing multiple divergences on lower timeframes like 1m 3m and 5m.
Also it is in Supply area and Resistance zone, meanwhile BTC is ready to go down a bit so it will too

AXIE INFINITY! THE $50 SUPPORT LEVEL WORKED OUT.Since November 2021, we have seen most cryptos and altcoins, even Bitcoin concede downtrend movements..
Price has continued to move to the downside here on AXS, but the support level at $50 has been holding strong so far.. We've seen price bounce multiple times from this key level.
Would we see a bullish rally?
Well, we might want to wait for uptrend structures to confirm a bullish rally. But we must understand that "buying the dip" is important at this time.
The all-time high is priced around $163, so picking up AXSUSDT here at $50-$60 is really reallyyyyyy cheap, basically at a discounted price.. I'm long on AXS. I'll be waiting for a new ATH.

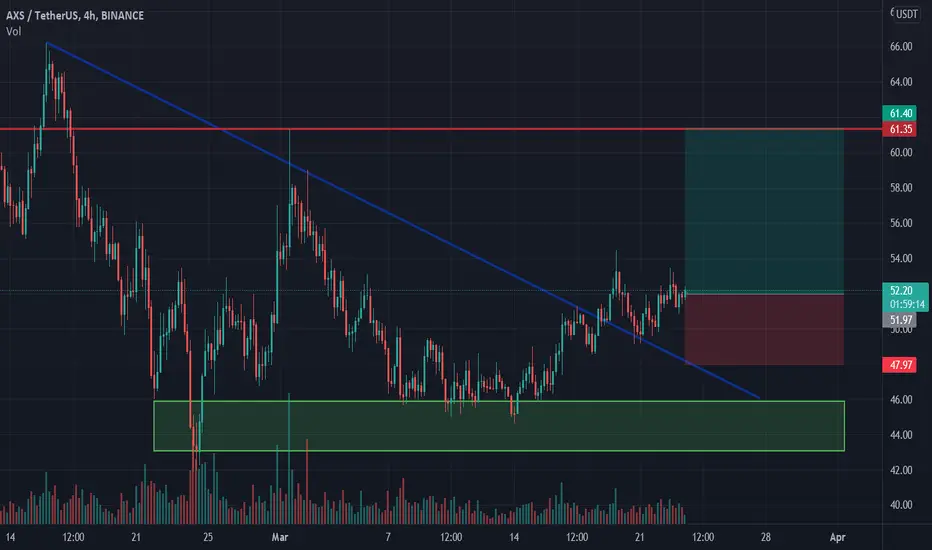
Axie Infinity longAxie Infinity bounced off the support area. Asset broke trough off the descending trendline. Bullish movement to resistance level at 61.35 is possible.
$AXS is gaining momentumAxie Infinity Season 20 is Over. The prize pool to be distributed to players is 117, 676 AXS. Currently, the circulating supply is 77, 242, 770 (28.6%) of the total supply 270m. By the end of December 2022, the expected circulating supply will reach 151, 807, 500 AXS (56.23%) 2 times that of current on circulation. Just how much this would add to the value of Axie Infinity ecosystem?

AXSUSDT LONGHello traders, according to my graphical analysis of AXSUSDT , i prospect an upward trend .
thank you for watching the analysis, it will be great when you support it with a like, follow me for more market analysis .

The falling tend is broken, our direction is up.AXS broke RSI and retested it and turned its direction up, it has not broken its rising trend down yet, which is a positive situation for us. Indicators herald the coming of bulls. After breaking the RSI in June last year, it had risen from $4 to $80... I expect it to rise again with this breakout, although it's not that big.
There is a correlation between AXS and SLP, they rise and fall at the same time. You can follow my opinion about SLP with the link I will leave below. Can you tell me what you see missing in my opinion or your appreciation by commenting, your ideas are important to me. If you like my idea, don't forget to like it and check out my other ideas. Be good to yourself.
It is not investment advice.

Axie, can we get a taxi to the moon?!Hi!
Axie's daily chart shows us that a nice
CURVED TRENDLINE pushes down the price everytime.
This time OBV has made a ascending triangle on 4H time frame and its getting ready for a breakout. Will it help axie to breakout its CURVED TRENDLINE and take us to the moon?!
Thanks
**this is not a financial advice and as alway DYOR!
