AXSUSDT (Long)AXSUSDT is bouncing off strong 4 hourly and weekly support zone
Long
Entry at 49.80
Take Profit at 51.41
Stop loss at 48.73
Risk/reward ratio of 1:1.82
AXSUSDT trade ideas

Is AXS going to touch 69 dollars again?!As my Elliot analyze has shown on AXS , I will go for a long position at 52.9 dollars which has very good Risk to Reward ratio. This is a short-term analyze and it will take couple of days to touch target, If no news speed it up.

AXSUSDT Is the next signal for jumpIt’s time to long AXS/USDT
Really ready for pumping like GALAUSDT
don’t miss that my friends

AXSUSDT, The market dont have enough power for risesHello everybody
I hope that everyone took our previous signal that we published and told anyone can take short on axs at 100$ and took nice profit.
AXIE (AXS) is one of the most popular project in crypto and in NFT market be consicious on it and watch it ...
According to the chart and our previous serial analysis the price broke the upward channel and now its trading in outside it and according to the key level that we published it in last analysis of AXS we shown on chart the zone that is more important and sensitive for the price and now as you can see the candles has not enough power for the rises and we expect the price can drop and break this support level and after some pullback its ready to dump more to reach to the next support zone area.
Please becareful and do not enter in position without observe your own strategy, and observe your capital management, this is market and everything can be happen.
Be with us and reign
Good Luck
Abtin
Previous analysis :


AXSUSDT 1D TA : In The ChannelIn the daily time frame, the channel is descending, which has reached its important daily support range, and we expect that with the support of the static price, the channel ceiling will be broken upwards and an uptrend will be formed. If the channel is not broken, a more severe downward trend will be formed.
Its not. Buy or Sell SIGNAL
DYOR
BY : Mohamad Teriz @AtonicShark

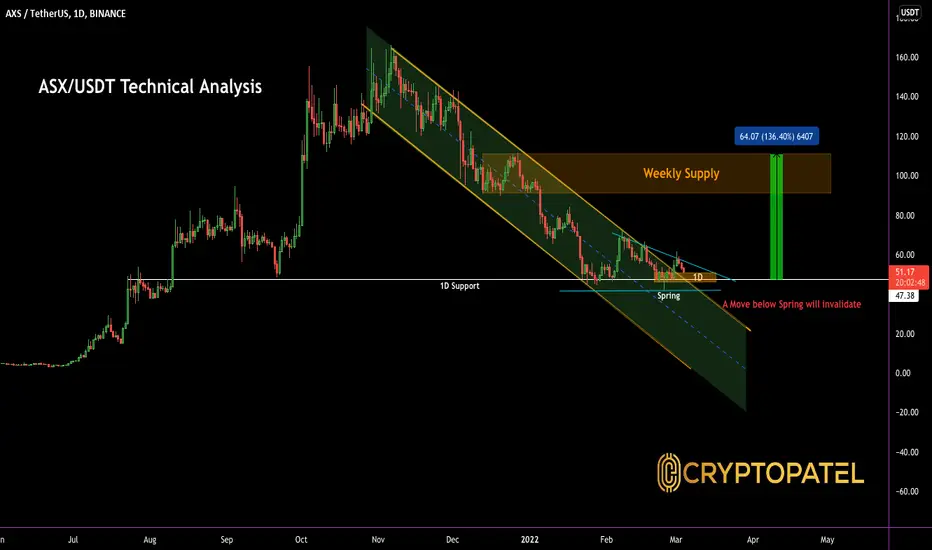
AXS/USDT Ready to move 136% from here as per TA ?#AXS/USDT TA Update:-
$AXS current price is $50.90
As Per chart Small Triangle form In HTF.
Rejected from Triangle resistance and Bouncing from 1D support.
So 1D Support is strong at $47 level.
Already Broke out this parallel channel resistance as per chart.
Targets will be Weekly supply which is $100-$120
Chart Invalidate below Spring.
Spring = $41.60
#AXSUSDT 4H Chart
Price got perfectly rejected from the 4h supply zone at $61 and ranged in a downtrend afterwards. MACD lines crossed and is now bearish, RSI and EMAs are neutral. Price is currently close to testing the 4h demand zone at $51.5 however we shall wait for further confirmation as overall market structure is still bearish for the short term.

Long for $AXS with medium risk.Bullish flag breaks out. Hope this idea was published on time. yikes! Manage your risk. This is not financial advise.

axsusdtperp longe , 1DDue to the stabilization of AXS on our static support, we expect growth up to the range of 90 and maybe 139.

AXSUSDT (Long)AXSUSDT in an upward trend, forming Three White Soldiers and recently broke through strong 4 hourly resistance level
Long
Entry at 54.66
Take Profit at 58.02
Stop loss at 51.61
Risk/reward ratio of 1:1

Inverse Head & ShouldersSimple Inverse Head & Shoulders trade. I expect an entry at the resistance I have drawn with a box.

AXSUSDT (Long)Long
Entry at 47.94
Take Profit at 50.42
Stop loss at 47.09
Risk/reward ratio of 2.98
The price has just bounced off the a strong support zone (4 hourly and weekly support)

GOLD SHORT POSITIONHello dear friends
I marked everything on the chart, I hope you enjoy
******Appropriate entry poin ts for supports and resistances according to the chart*******
If you like this idea, Please Follow me and do not forget that your likes and comments are very important
Thanks dear friends.
Be generous and rich.

Axie Infinity AXSUSDT Strong resistance levels, LONGThis idea is based on a trend line and resistance levels as can be seen with shaded area. The Fib level of 0.5 being about the half of the price drop is our target. Waiting for the price action to confirm the change of the trend, also see RSI as right now this is just about to change
This crypto mission is to bring blockchain technology to the masses- it's a play-to-earn crypto built on the Ethereum (ETH) network, users can earn the Axie Infinity Shard token and the other in-game tokens in Pokemon-inspired universe.

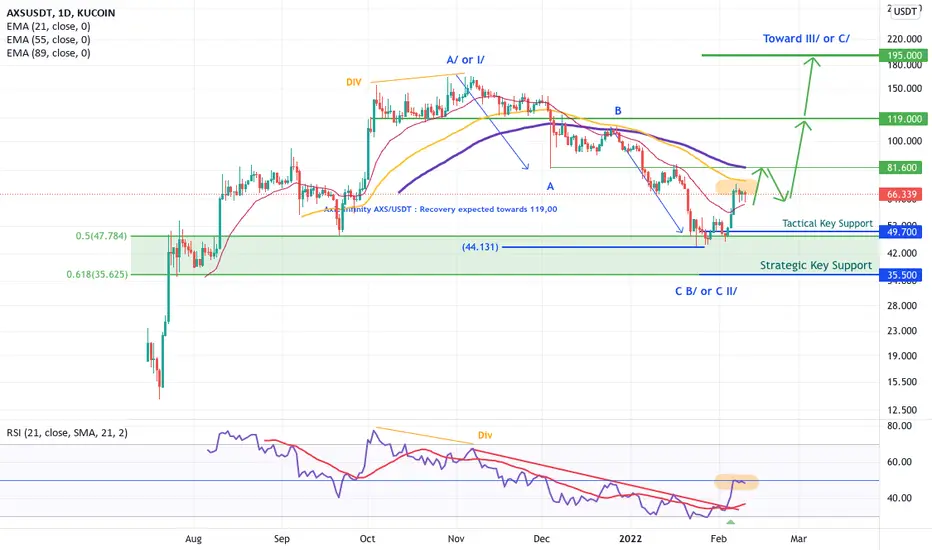
Axie Infinity AXS/USDT : Recovery expected towards 119,00Axie Infinity AXS /USDT : Recovery expected towards 119.00
Axie Infinity is a blockchain-based trading and battling game that is partially owned and operated by its players.
The Axie Infinity ( AXS ) token is an ERC-20 token launched on the Ethereum blockchain. As a result, it is secured by Ethereum’s proof-of-work (POW) consensus mechanism.
Context
AXS /USDT has been listed in the middle of the last year, so the historical data are not really mature for a deep target projection. However Focusing on Daily and 3H basis we can already highlight key technical elements to understand the actual picture
For now the initial raise can be describe in 3 wave up move (Corrective - A/) or 5 wave up move (Impulsive I/) - depend if you switch the scale between lin or log, on my side i would be more confortable with an impulsive move at this stage. So once that it said and as i described on the chart, the following move (down leg) has been done in 3 wave down (A-B-C corresponding to a logic corrective move in wave B/ if we are in ascending range towards 195.00 and more if we are in a impulsive long-term trend - it what we are calling a ''common part'' between to different scenario)
So the configuration is quiet nice because the wave A = Wave C and the market bounced off 50/61,8 retracement which are standard to respect a proportion for this kind of Harmonic / elliot wave pattern, the determinism of the behavior behind the scene is strong a significant rise is clearly more likely.
Tactical view (1 to 3 weeks)
As you can see for now the RSI and the 55/89 EMA didn't provide a bullish pre-signal, only the 21EMA is acting as support, and we have a small ''evening star doji'' capping the recovery. Those elements can call for a last down leg towards the strategic support but for now the construction of the recovery is more impulsive than corrective so those element for now stay weak within the long-term determinism on going.
As long as 49,70 remains key tactical support ( Pivot ) a direct rise is more likely towards 81,60 before 119,00
else penetrating 49,70 a test of 35,50 Strategic key support ( Pivot ) will occur before any bullish tentative
Also i recommand to have a look on SLP /USDT which is also a native ERC20 coin connect to Axie ecosystem, - i will soon published something on it
Enjoy !
AXSUSDT LONGPrice is consolidating for a moment at price zone. I predict that the price will proceed to the next zone where it will consolidate again.
My position for this is Long. Please trade wisely.

Don't stop a trainAXS teaches us to not try and stop the train. It's trend is going down, no doubt about it. And it trends hard when it trends.

Axie Infinity (AXS) - February 23Hello?
Traders, welcome.
If you "follow", you can always get new information quickly.
Please also click "Like".
Have a good day.
-------------------------------------
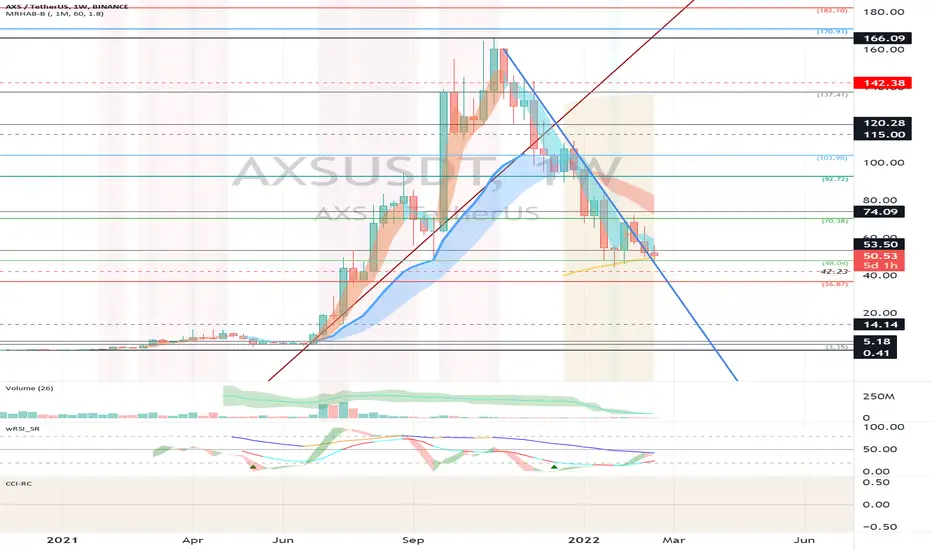
(AXSUSDT 1W Chart)
First resistance section: around 70.38
Second resistance section: 92.72-103.90
Support section: 36.87-48.04
It is important to keep the price above the 53.50 point in order to completely break out of the downtrend line.
If it goes down, you should check to see if you find support in the support zone.
(1D chart)
In the movement between February 25th - March 13th, it is necessary to check which point in the section 36.87-48.04 deviates.
If it falls below the 36.87 point, there is a possibility that it will fall near the 14.14 point, so a Stop Loss is required to preserve profit and loss.
A move above the 48.04 point is expected to lead to a move to move above the 70.38 point.
However, careful trading is required as it is expected to swing up and down to cross the M-Signal line of the 60SMA and 1W charts.
This movement is expected to occur near the 59.03 point.
-------------------------------------
(AXSBTC 1W chart)
Resistance range: 0.001906-0.002143
Support period: 0.000723-0.000960
It is important to rise above the 0.001433 point.
In particular, it should break out of the downtrend line.
Otherwise, it is expected to consolidate in the 0.000960-0.001433 section.
------------------------------------------
We recommend that you trade with your average unit price.
This is because, if the price is below your average unit price, whether the price trend is in an upward trend or a downward trend, there is a high possibility that you will not be able to get a big profit due to the psychological burden.
The center of all trading starts with the average unit price at which you start trading.
If you ignore this, you may be trading in the wrong direction.
Therefore, it is important to find a way to lower the average unit price and adjust the proportion of the investment, ultimately allowing the funds corresponding to the profits to be able to regenerate themselves.
------------------------------------------------------------ -------------------------------------------
** All indicators are lagging indicators.
Therefore, it is important to be aware that the indicator will move accordingly as price and volume move.
However, for convenience, we are talking in reverse for the interpretation of the indicator.
** The MRHAB-O and MRHAB-B indicators used in the chart are indicators of our channel that have not been released yet.
(Since it was not disclosed, you can use this chart without any restrictions by sharing this chart and copying and pasting the indicators.)
** The wRSI_SR indicator is an indicator created by adding settings and options to the existing Stochastic RSI indicator.
Therefore, the interpretation is the same as the traditional Stochastic RSI indicator. (K, D line -> R, S line)
** The OBV indicator was re-created by applying a formula to the DepthHouse Trading indicator, an indicator disclosed by oh92. (Thanks for this.)
** Support or resistance is based on the closing price of the 1D chart.
** All descriptions are for reference only and do not guarantee a profit or loss in investment.
(Short-term Stop Loss can be said to be a point where profit and loss can be preserved or additional entry can be made through split trading. It is a short-term investment perspective.)
---------------------------------
Possible long on AxieWe will likely see the volatility spike on $AXS as it is bouncing off the long-term support level and the major descending trendline is pretty close to the price right now. In case of the breakout through the trendline - bullish movement in expected to continue and reach the resistance level at 112$

AXSUSDT 4H TF IdeaAXS possible H&S pattern on 1D TF.. Possible scenario |||| (if BTC don't suck things up) lmao
DYOR

🔻 AXS short 🔻hello traders and investors.
we can open a short position if the daily candle closes below the moving average.
Disclaimer: this is not a piece of financial advice, always do your own research.

