BADGERUSDT trade ideas

BADGER/USDTNew bagholder special. If price closes above the diagonal trendline on a daily basis that would give the green light to start accumulating for a longer term hold. After the break anything near the trendline is a buying opportunity. Targeting around $150 as a final take profit. Will update idea.


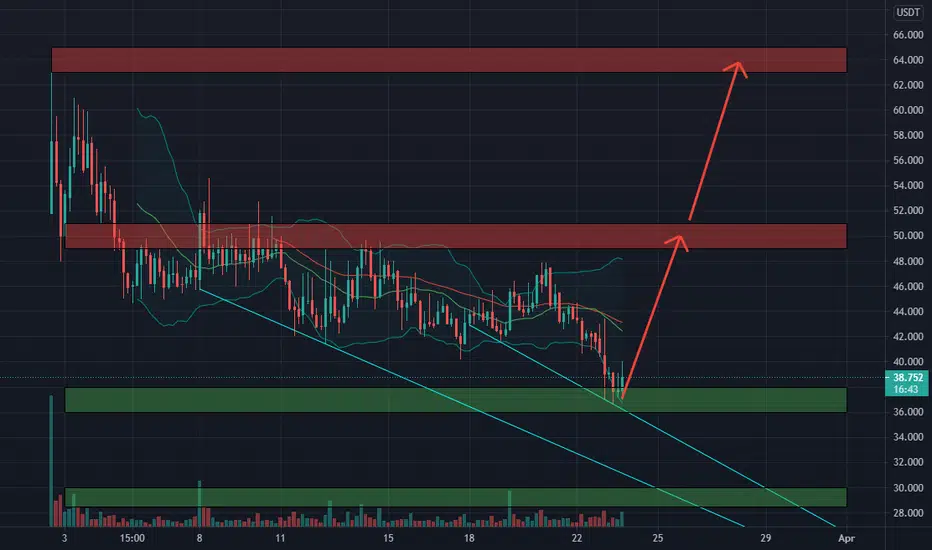
🆓Badger DAO/USDT Analysis (23/3) #BADGER $BADGERThe buying force has appeared at the 36-38$ zone, we can take risk to catch it here for targets : 50$ and 64$ in the next few days
Actually it still can keep dumping to 30$ zone so you should pay attention to this 36-38$ zone
📅EVENTS
👉Mar 24 : NFT Drop
👉Mar 31 : Badger Jersey NFT
📈BUY
-Buy: 36-38$. SL if B
📉SELL
-Sell: 49-51$. SL if A
-Sell: 63-65$. SL if A
♻️BACK-UP
-Buy: 28.5-30$ if A. SL if B
❓Details
Condition A : "If 4H candle closes ABOVE this zone"
Condition B : "If 4H candle closes BELOW this zone"

Badger Important Day for the close need 46.50 or 36 incomingNot financial advice.
Need daily close above 46.50 to break the downward trend its been n.
If no close above 46.50 at 8pm Eastern time. The daily close then expect it to come down to 36.50 range.
It's overextended in the 4 hour so I expect a pullback today unless the whole market in general stays in the positive.
I'd be careful for entry to a confirmed breakout
And set your stop losses very tight.
Won't take much for it to nosedive to 36.50 range.
Support the legalizedhustler
#hustlabynature
#financialnostradamus
Soon to be cccllc

🔥BADGER divergence#BADGER/USD
📌BADGER divergence
🔹Analytics: the indicators show a completely different picture, bullish divergence on the indicators, I expect good growth soon, just as if you have been trading for a long time, you can see the trend reversal by eye.


BADGER usdt - has it finally broken it's downtrend?Good growth with badger, working it's way from the bottom of the downtrend line.
EMA is trending upwards and candles holding above EMA trendline.
Good trading volumes.
Expect to see it go to the $50 levels soon, so good buying here.


BADGER-- Keep an eye on itHi Friends !
One more interesting trade *BADGER*.
BADGER was down almost 60% from ATH. Price have many bottoms tested at the same level.
Then price move up and now it is testing the 55 EMA at 1D time frame.
Candlestick pattern : 1 Red candle and second one is making dozi at the 55 EMA level. Just wait for this candle to close for today. If it close above 55 EMA, it is a good sign of reversal.
Note > Price already broke downtrend line and MACD is making bullish interest in HISTOGRAM
I am not a financial advisor. Just want to give you an idea, how price is working in this market.
Hilsen
Btschamp2020

Badger DAO almost formed Butterfly for upto 32.5% bullish moveHi dear friends, hope you are well and welcome to the new update on Badger DAO.
On the 12-hour chart, the price action of the BADGER has almost completed the bullish Butterfly pattern.
Possible profit and loss ratio:
This trade has a huge profit possibility of 32.5%, and the high loss possibility up to 9%.
Note: Above idea is for educational purpose only. It is advised to diversify and strictly follow the stop loss, and don't get stuck with trade.

BADGER usdt - still working it's way into a wedgeI don't think it'll break to the upside.
The EMA is downturning on the 1h chart.
Prepare for a slide if you're a badger holder.


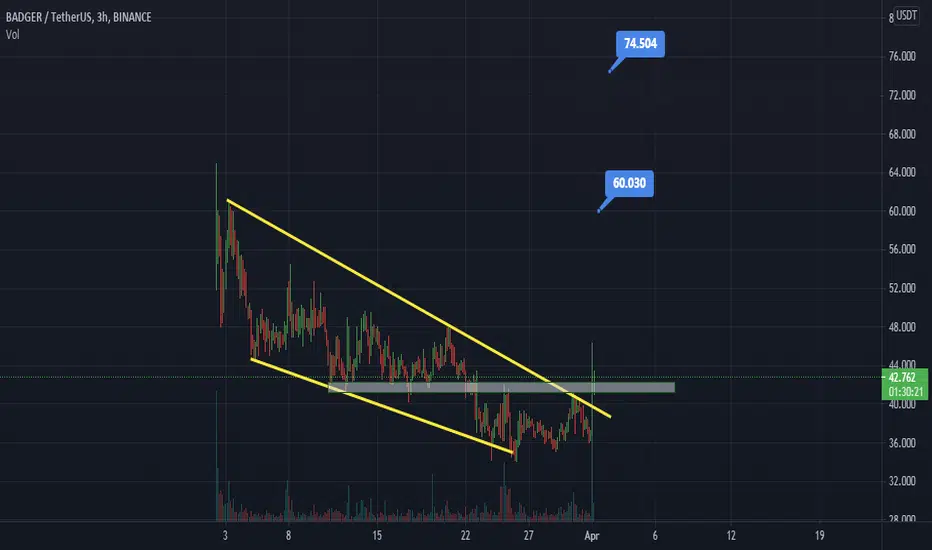
BADGERUSDT (BADGER) - POTENTIAL BUY ENTRY ANALYSIS 🔎
- BADGERUSDT was bounded in the falling wedge pattern.
- A falling wedge pattern is a bullish reversal pattern
- Price brokeout above the falling wedge's resistance as expected.
- The market then retraced for a retest.
- Price is retesting the falling wedge's resistance, ascending trendline support (ATS) and key fibonacci retracement zone (0.5 - 0.618 - 0.786).
- There's a relatively high concentration of buyers at this retest zone.
- The retracement is resisted by the descending trendline resistance (DTR).
- Breakout above this trendline resistance could be a bullish signal.
BUY ENTRY ⬆️
- Breakout above the descending trendline resistance (DTR).
TARGETS 🎯
- Horizontal resistance level (R1).
- Fibonacci extension levels.
- Horizontal resistance level (R2).
SETUP INVALIDATION ❌
- Breakdown below the 0.786 fibonacci retracement level and the ascending trendline support (ATS)


