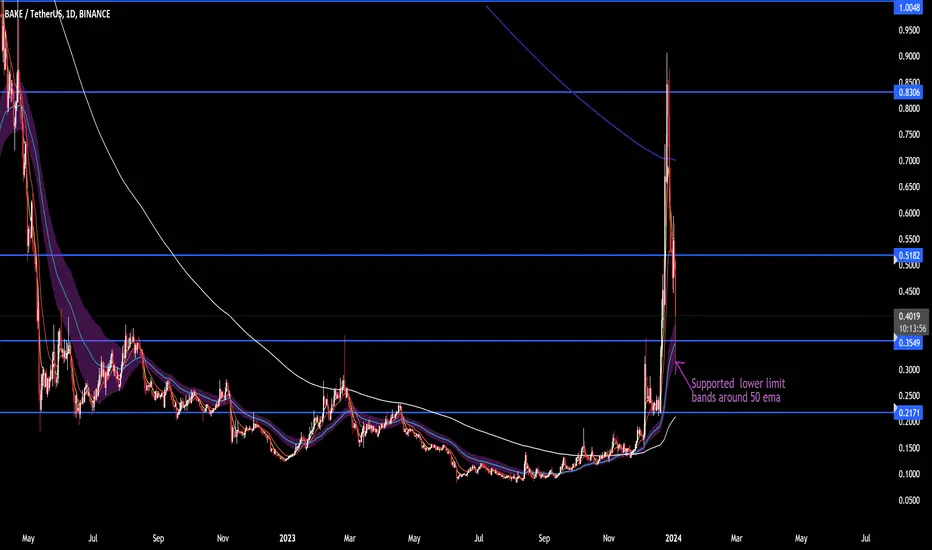
bake inteligentassetThe daily low is supported by the lower limit of the bands around the 50 ema
Bullish scenario
Resistance 0.518
Bearish scenario
Support 0.54 Consolidation trend line with 50 ema
BAKEUSDT trade ideas
Bake FuturesWe can see the end of wave 1 few weeks ago and it is now getting ready for a bigger wave 3, so sitback and enjoy

✴️ Bakery | The Bottom Is In + 333% Target (Name Your Altcoin) Are you a baker?
Many Altcoins hit bottom in September and October, this bottom being technically part of a correction rather than the end of a bearish impulse, what's the difference?
We will leave the explanation for another article, let's focus on the signals at hand, BAKEUSDT.
Our concern is with a bullish reversal, with a bullish wave, with Cryptocurrency growing, with a green Bake; do we agree?
The signals are clear if you ask me.
Volume is always the best indicator or the strongest confirmator but it needs context to work.
Whenever a move is accompanied by volume, we know the move to be either "real" or strong.
Back in November/December 2022 a bottom pattern showed up that led to a weak rally... The lack of volume predicted that the rally wouldn't last and it didn't, it ended in new lows.
Now, in June/September 2023 we have a new bottom pattern but this time supported by really high volume, this tells us that the next rally will be strong and is likely to end in a higher low rather than new lows, meaning, long-term growth.
➖ Bullish divergence with the RSI and MACD as well.
➖ BAKEUSDT is trading above EMA50.
You can find the targets on the chart...
Thank you for reading.
I am sending you kisses... Lol, just kidding!
Namaste.

#BAKE WILL PUMP HARD🤑#BAKE WILL PUMP HARD🤑
I will Enter Long position after breakout of green residence line.
And after retest will go High 🤑
Watch out for BAKE
BAKE made a nice rise and returned from 0.9. If it gets a reaction from the support point at 0.5 and stays above this level, we can see a nice rally in the long term.
In my opinion, the 2.35 level is the main target in this bull season and a buying zone between 1.6-2.3 may occur in the next period.

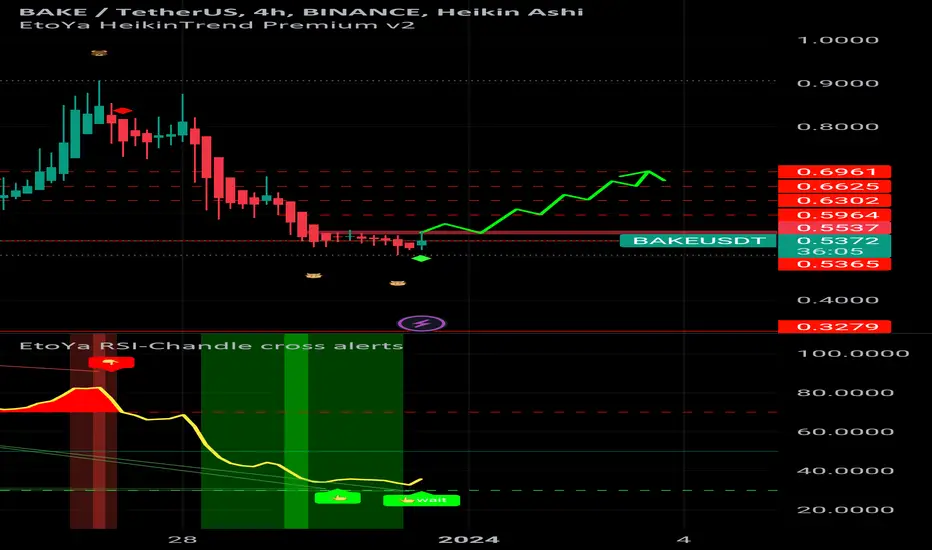
BAKEUSDT.P lONGI'm entering a Swing Trading Position on BAKEUSDT.P perpetual swap, as a clear 1-hour trend line breakout has occurred. Targets are set at 0.56, 0.58, 0.60, and 0.62 levels. Due to elevated risk, a stop-loss is placed at the entry point to protect against potential losses if the first target is reached.

BAKEDOWN (Extremely Bullish)This is an amazingly bullish scenrio right here
these tokens are new and you can't put sell or buy orders larger than .5% from the current price leaving there way less support and resistance.
A traders dream!

BakeryToken (BAKE) completed a setup for upto 46.50% pumpHi dear friends, hope you are well and welcome to the new trade setup of BakeryToken (BAKE) with US Dollar pair.
Recently we caught almost 316% massive pump as below:
Now on a 4-hr time frame, BAKE has formed a bullish BAT move for the next price reversal.
Note: Above idea is for educational purpose only. It is advised to diversify and strictly follow the stop loss, and don't get stuck with trade.


116% increase BAKE VOLUMEFor the low time frame we did expect a recovery fall for Bake, it seems Bake have a powerful trend on the long-term side withholding and building trends that can show unexpected break.

Mock Up Price Action for BAKE | Mid Term (12HR)Mock Up Price Action for BINANCE:BAKEUSDT | Mid Term (12HR)
- Watching and waiting for opportunity to enter short
Personal Approach & Base Chart Setup
- Stacked Parallel Channels for Grid of Confluence Points
- High Time Frame (HTF) Fib Extensions, Retracements, & Time Cycles
- Red Filled Horizontal Rectangles between areas of major Fib level from Extensions and Retracements
- Price Label Callout with Red Circle highlighting points of interest where I'd consider making a trade
- I will consistently monitor and adjust taking into consideration long/mid/near term price action and market conditions/news

BakeIf it will give a strong Bakeout I will open a long position on Bake. let's Fu*****K the bake 😎😎😎

BakeryToken BAKE Coin Price Prediction🔥 Price on the 4H chart might come at these support area and we might get a potential bounce🔥
Potential bounce areas for Buying 0.5723 and 0.4770 and 0.3704
👉 Follow me for More Real Time Opportunities.
Share your Thoughts if you have any?


jeffans: BAKEUSDT searching the way to +200% LONGjeffans: BAKEUSDT searching the way to +200% LONG
Two FVG1W magnets ahead of this move.

BAKE'USDT end of movement mega move from Bake since last post on long position now about to finish its cycle 35-40% down move .
SL if any candle close above 0.67 then setup will be cancel

We are currently in an upward trend (BAKE)❤️❤️Thanks for boosting 🚀 and supporting us!
📈We are currently in an upward trend, and this trend needs a small correction to go again.
📊 (Buy) :0.260
🔴 Stop Loss : 0.2055
🎯 Take Profit : 0.324-0.416-0.459
🔗 For more communication with us, In the footnote and send a message in TradingView.
👨🎓 Experience and Education: Our trading team has five years of experience in financial markets, especially cryptocurrencies.

BAKEUSDT.1DBased on the market data provided, the BAKE/USDT pair appears to be in a strong uptrend. This is indicated by the high Relative Strength Index (RSI) values across the 4-hour, 1-day, and 7-day periods, all of which are above 70. The Moving Average Convergence Divergence (MACD) values also support this bullish sentiment, as they are positive across all three timeframes, suggesting that the upward momentum is strong.
The Bollinger Bands (BB) on the 4-hour, 1-day, and 7-day charts also indicate a bullish trend, with the current price of 0.4462 being above the middle band in all cases, suggesting the price is trending upwards.
The support and resistance levels indicate potential levels at which the price might bounce back or face resistance. The nearest support level on the 4-hour chart is at 0.3176 USDT, while the nearest resistance is at 0.4650 USDT. On the 1-day and 7-day charts, the nearest support levels are at 0.3002 USDT and 0.1659 USDT respectively, and the nearest resistances are at 0.4867 USDT and 0.4820 USDT respectively.
In conclusion, based on the technical indicators, BAKE/USDT appears to be in a strong bullish trend. However, it's important to note that these indicators do not guarantee future price movements, and they should be used in conjunction with other forms of analysis and risk management techniques. Always invest wisely and only risk what you can afford to lose.

BAKE Coin Price Prediction🔥 Price on the 4H chart might come at these support area and we might get a potential bounce🔥
Potential bounce areas for Buying 0.2764 and 0.2194
👉 Follow me for More Real Time Opportunities.
Share your Thoughts if you have any?

BAKE(BAKEUSDT): IMPORTANT BULLISH BREAKOUT ↪️Bake is currently trading in a long-term bullish trend. When analyzing the intraday price action, it can be observed that the coin has formed a descending triangle pattern. Recently, the price broke and closed above the triangle resistance level. As a result, I am anticipating a bullish continuation towards the target above...Trade safely.👍✅️

"BAKE/USDT Long Trade Analysis: Falling Wedge Breakout Signals RTrade Setup for BAKE/USDT: Long Position
Analysis:
BAKE has broken out of a falling wedge pattern, indicating a potential reversal.
The current market situation involves a retest after the breakout.
Entry:
Entry Point: Current Market Price (CMP)
Additional Positions: Consider adding more if the price drops to $0.2228.
Targets:
$0.255
$0.277
$0.2944
$0.32
$0.38
Stop Loss (SL):
Set the Stop Loss at $0.2138 to limit potential losses.
Leverage:
Use leverage cautiously: 5x to 10x.
Risk-Reward Ratio (R:R):
Risk-Reward Ratio is 1:6 (Lucrative).
Caution:
Use leverage in accordance with your risk appetite and be conservative to mitigate significant losses.
Perform your own research (DYOR) before making any trading decisions.
This information is not financial advice.

BAKEUSDT.PBAKEUSDT.P is in bearish trend.
Printing LH and LL.
Bearish divergence also shown in RSI.
Head and Shoulder Reversal pattern also form top of the Trend.
We wait and watch for the breakout of Neckline of Reversal pattern.

BAKEUSDT(BakeryToken) Daily tf Range Updated till 05-12-23BAKEUSDT(BakeryToken) Daily timeframe range. very impressive pump on daily. trying to tackle 0.3254. this thing got huge range gap in PA. 0.3254 breaking clean can lead it to 0.4948. if not fails.
