BALUSDT ContinuationBALUSDT has broken out of a bullish continuation pattern and is now heading up. RSI bounced off the 50 and volume is increasing. We could see a brief see some profit-taking before continuation to target. Good luck!
BALUSDT trade ideas


BAL/USDT Bullish Channel ReversalBAL/USDT doesn't seem much affected by the recent bearish movement from Bitcoin. On the contrary, it reversed sharply from the bottom trend line.
At the moment, the only target to beat is marked at R1, which is the last high where the upper trend line was touched.
Happy trading!


BALUSDTMarket structure are currently bullish, look at bigger TF for a bigger picture.
Happy Trading
RR 1:3

BALUSDT - wrong / correct break outBiko membership understand me
Push the like button, write a comment, and share with your mates - that would be the best THANK YOU.
make your analysis before a trade

BAL/USDT Double Break OutBAL/USDT has seen amazing bullish price action in the last week, increasing with almost 50%!
In the last 24 hours the price has both broken out from the channel and from the bullish triangle. Let's hope that these break outs will lead to more bullish action!
Seeing the size of the candles of the last couple of days, I'm confident we will see more of that in the near future. I've marked two areas of potential resistance, R1 and R2, where I expect the price to either consolidate or reverse. R1 based at the September high and R2 based at the round number of $30. If we're gonna see anything like an alt-season, this is a pair to keep your eyes on.
Happy trading!


Entry Point for Balancer Liquidity PoolsIf confirmed, this dip could be a great opportunity to enter a Liquidity Pool in Balancer. The returns are great at the moment with the liquidity mining.

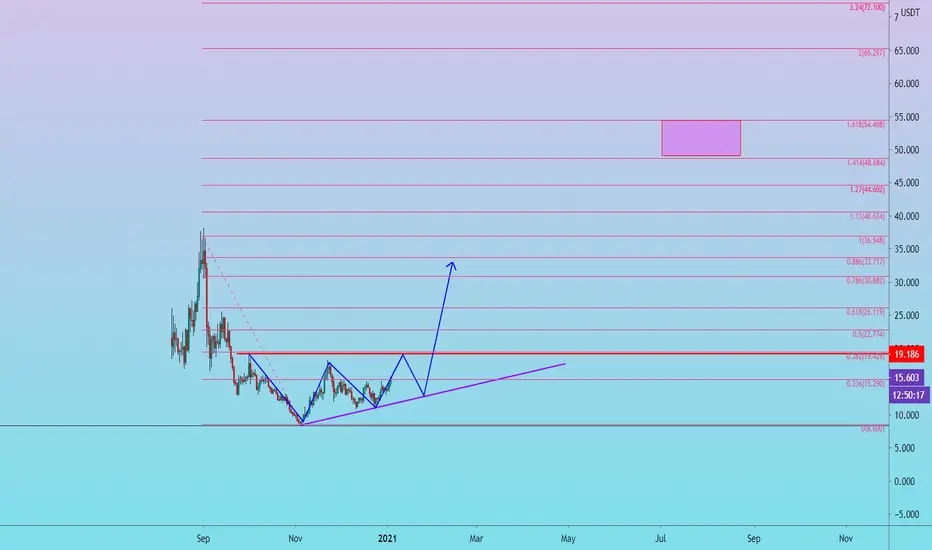
Double bottom - BALUSDT Review 📚Good day everyone.
Today I'll be discussing on the double bottom trend reversal pattern.
1. DEFINITION
What is a Double Bottom?
A double bottom pattern is a technical analysis charting pattern that describes a change in trend and a momentum reversal from prior leading price action. It describes the drop of a stock or index, a rebound, another drop to the same or similar level as the original drop, and finally another rebound. The double bottom looks like the letter "W". The twice-touched low is considered a support level.
2. ENTRY
The entry ( buy order) in double bottom pattern is placed just above the neckline resistance.
3. TARGET ( TAKE PROFIT)
The target of a double bottom pattern = the distance of the bottom head to the neckline resistance.
When a double bottom is spotted in a channel or rectangular pattern support. Your target should be the channel resistance and rectangular pattern resistance respectively.
4. STOP LOSS AND SETUP INVALIDATION
The setup invalidation is a breakdown below the double bottom support.
The stop loss is half the distance of the setup invalidation.
5.TRADE EXAMPLE
I'll be using my analysis on BALUSDT as a trade example on double bottom.
The trade played out as expected from my previous analysis.
My buy entry ⬆️ - breakout above the double bottom neckline resistance.
My targets 🎯 - previous swing high, ascending channel resistance.
My setup invalidation ❌ - breakdown below the double bottom support + ascending channel support.
My stop loss 🔴 - setup invalidation / 2.


BAL - lONGBAL has broken the resistance of $17.61 and is now approaching the resistance zone of $19.33. If it can break this resistance of $19.33, it could push towards $20.21, $22.50 and $24.63. Failure to break the resistance at $19.33 could lead to a drop towards $17.61, $16.00 and $14.76.

Possible trade for BalusdtWatching after breakout ! I still cannot get levels for Elliot Wave and will update when I can!

BAL Price At Resistance | S/R FlipBal cryptocurrency token at the resistance
Flip above the red zone will send price higher buy the retest of the red zone

#BALUSDT (watchlist)What we mean by Add this coin to the watchlist ?! 👀
This means the coin we mentioned shows a reversal pattern or moving near a historical bottom, around or above good support, increase in trading volume, accumulation stage, etc, so, we tell you to keep your eyes on this coin until the right time for entry and buy.
In the end, This is not financial advice, The purpose of these Charts to give you an idea about coin movement (not buy or sell signal) so before following any idea be sure to do your own research, and follow your risk management. Also, the information we mentioned here is a personal effort that is subject to success or failure and we welcome constructive criticism, Hitting "like button" and leaving your "comments" below our thoughts is great and supports us provide more ideas❤️
Good luck to all.
we ask Allah reconcile and repay🙏


BAL / USD - Just a viewGreen lines are expected TGT, after breakout of Blue line. Trial the SL with every big green candle made...

BalusdtBINANCE:BALUSDT
What we see now ?
1-the price at 15$
2-the next resistance at 16,9$
3-the support level at 13,10$
4-there is 3 positive buy signals are active
5- the candle is above downtrend line
What we have to do now ?
1- wait for daily closing above the downtrend line then it’s a good opportunity to take a position in this trade
2- take profits in resistance levels
3- follow the robo sell signals if you see 2 of 3 the close the deals
Trade with you own responsibility

Balancer (BAL) - Higher lowsFollowing a 70% correction (now 50%) and oversold condition, price action on the above 1-day chart is now printing a strong trend reversal. The higher lows in price action are also mirrored by the oscillators with higher highs in RSI and Stochastic RSI. Very bullish.
1st target $27
Should RSI support remain active (blue line) after target price is met then price action is expected to be in uptrend until mid-2021.
The weekly chart (below) printed a long tailed Dragonfly DOJI indicating strong buying pressure in the weeks ahead.
