BAL/USDT Preparing for a Bull Journey? 👀🚀 BAL Analysis💎 Paradisers, direct your focus to BALUSDT, as it showcases a compelling market behavior. This asset is hinting at a possible bullish progression from a crucial support level.
💎 Recently, Balancer encountered resistance at the $4.43 level. Presently, if BAL can sustain its position at the important support level of $3.65, we may witness a bullish trend continuation from here. This optimistic view is further supported by BAL's robust performance above the EMA, suggesting a continued upward trajectory from the support.
💎 Conversely, if BAL struggles to maintain its ground at the $3.65 support, a shift in strategy might be required.
💎In this alternate situation, we could prepare for a bearish movement starting from a lower demand zone at $3.65. Notably, if BAL breaks below this level, it could be indicative of an emerging downward trend.
💎 Stay alert and ready, Paradisers. Your ParadiseTeam is here to equip you with the necessary insights for navigating these market scenarios, ensuring your trading decisions are well-informed and strategically sound.
BALUSDT trade ideas

BAL USDT (Long Trade Setup)Technical Analysis behind BAL USDT trade:
1. Trendline Breakout & Supported by the immediate support area.
2. Three White Soldiers Candlestick pattern formed, a bullish sign.
3. Supported by the 200 Days SMA.
4. RSI is at 60, a bullish sign.
5. Volume & Momentum analysis also supports the trade.
6. The stop loss is based on the volatility indicator (ATR)

BAL, CUP HANDLE FORMATIONBINANCE:BALUSDT Depending on market developments. BAL may rise by %70 with the cup handle formation. The decisive factor here is the status of Bitcoin and the resistance point at $5 and $7.27.
Please do your own research. What I write here is not investment advice but an opinion or predition.


BAL / USDT - BullishShow some strong signs:
1: Up trend
2: retest previous high
3: wait to breakout VWAP
If VWAP breakout happen
Target
1. 200 MA
2. 4.5 level
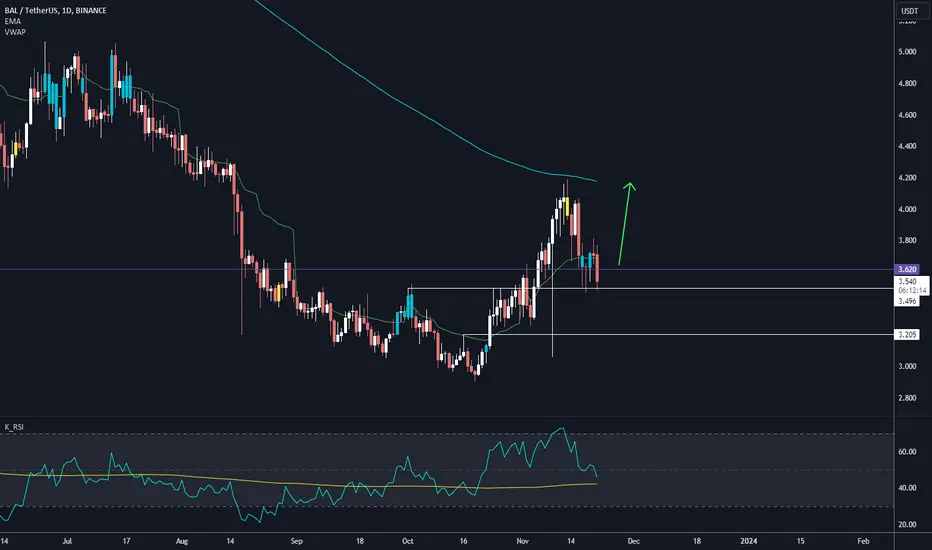
BAL / USDT - BullishShow some strong signs:
1: Fake breakout at 3.620 level
2: Fake breakout at last high 3.496
3: wait for VWAP breakout
If VWAP breakout and hold
Target
1. 200 MA
2. high at 4.187

BALUSDTBALUSDT was trading under declining trendline and recently it seems like the sellers are bit exhausted then bulls took the charge and break through declining trendline.
Currently the price has given the breakout from falling trendline and now forming a local support around 3.6 region.
Will the bulls take charge again continue for leg higher?

BALUSDT TODAY NICE SWING1-Apply your own risk management.
2-Daily and Weekly Targets
3-Hunt the profits at any level you see convenient for you.
15% SPOT no SL

BALUSDT.PHello Trader BINANCE:BALUSDT.P
I see the potential for a short position here as the resistance area has not yet closed on the daily time frame.
for anticipation I try as much as possible to provide a tight stop loss in this pair.
Please add a comment and Positive feedback and
constructive criticism are important to authors and the
community.
Disclamer: Not Financial Advice

Balancer (BAL) - Falling wedge breakoutOn the above daily chart price action has corrected 60% since the year began. A number of reasons now exist to consider a long position, including:
1) Price action and RSI resistance breakouts. The trend has reversed.
2) Price action prints a bullish engulfing candle on past resistance followed by a hammer candle. What a chart.
3) The falling wedge measures a 140% reward.
Is it possible price action falls further? Sure.
It is probable? No.
Ww
Type: trade
Risk: <=6%
Timeframe to act: now
Return: 100% to start

BAL/USDT upward momentum? ? 👀 🚀 BAL Today analysis💎Paradisers, turn your attention to BALUSDT as it showcases a compelling trajectory within the demand zone, hinting at a heightened likelihood of an upward trend.
💎 Post its breakout from the descending channel, BALUSDT has been charting a bullish path. A potential resistance awaits at 3.527. Surpassing this level amplifies the probability of a continued bullish ascent.
💎 However, should it encounter a formidable rejection at this resistance, there's a chance it might seek support and continue its bullish momentum from the demand zone at 3.122.
💎 A breach below this demand level could tilt the scales towards a potential descent, possibly leading to a retest of the underlying support.

BAL USDT PERPHello Trader BINANCE:BALUSDT.P
the area is over breakout and there is a small resistance area for a decline first before really continuing to bullish upwards.
Please add a comment and Positive feedback and
constructive criticism are important to authors and the
community.
Disclamer: Not Financial Advice

#BAL/USDT breaks the Trendline in 1-Hour TF!#BAL/USDT breaks the Trendline in 1-Hour TF!
I am expecting a scenario like this and looking for short. CSEMA:BAL is bouncing from the PDL $3.265 support level. The next support level is PWH $3.2.

BAL/USDT upward momentum? 👀 🚀 BAL Today Analysis💎 Paradisers, turn your focus to BALUSDT! We've observed it showcasing a promising opportunity, having recently retested channel support and now gearing up for a bullish ascent.
💎 A brief look back shows that #Balancer broke through the channel resistance, setting itself on a bullish path. Interestingly, before this move, it had a brief fakeout, crossing the same channel resistance. Currently nestled in a demand zone, we're hopeful that a retest of a formidable resistance is on the horizon.
💎 On the flip side, there's another scenario to consider. If it adheres to its trend trajectory and breaks below both the trend line and the demand zone, there's a strong chance it could descend to retest the support level.
💎 If you are contemplating trading, employ proper stop loss and trade judiciously. Keep your strategies sharp and stay ahead in the game!

#BAL/USDT took the liquidity below the PWL and PML in 4-Hour TF!#BAL/USDT took the liquidity below the PWL and PML in 4-Hour TF!
CSEMA:BAL currently claiming PML $3.145 level. If it claims it successfully, it will pump hard.
Looking good for Long position and risk to reward ration is also amazing.

BAl usdt low market capwhile BTC in bearish sidewise ,we have another low market cap pick for next few days ,volume start pickup slowly ,would like to see move from here .
TP#1 : 3.63$
TP#2 : 3.77 $
TP#3 : 3.93$

Am i right ya wrongBalu Usdt Analysis
Ema Price Action
Overbought... rejected from 200 Ema In 15 Min Chart

#BALANCER | #BAL Potential 6.1% Long#BALANCER | #BAL Potential 6.1% Long
| Targets On Chart
A little slow on publishing as I was busy entering! Although nice breakout on the RVD which we like to see and then the further confirmation is the bullish divergence. Nice RR so looks like its worth the risk

TRADE OF THE DAY | BAL with bearish div. further drop incomingTRADE OF THE DAY | BAL with bearish div. further drop incoming
Some strong confluences here on the pullback for BAL to start its next leg down - with a new range looking like its forming and a bearish divergence a break in the RVOI is all that we were looing for.

#BAL/USDT - Long - Potential 4.68%Direction: Long
Market: Spot
Risk: 0.25% - 1%
#USDT_BAL
Exchange: BINANCE
Timeframe: 360
TP1: 4.764
Entry: 4.55
STOP: 4.336
Entry Conditions:
| Trendline break
| RVI break
| Coming in from oversold
| Unfilled bullish pivot
Beware of the FED announcement volatility. I'd close early if up prior to the announcement in 6 hours. We can see wild swings in price in the minutes before the rate drops. Also if it is the anticipated pause check total market cap if BTC pumps. A lack of new liquidity will mean BTC dominance pumps even further pulling money from alts to fuel its breakout.

balusdtNobody Knows Where is Price Going.
Hey traders, here is the analysi.
If you guys like my analysis please hit like?? and follow.
Thanks.
DISCLAIMER- This is not financial advice.
SMART MONEY CONCEPT.
identify Liquidity Or Become Liquidity

Long BALBAL is currently in a bullish position due to the engulfing 8-hour candlestick pattern, coupled with a test of the first Fibonacci level. I anticipate that these Fibonacci levels will be broken since they lack sufficient strength to stall the price action. Furthermore, there is a notable bullish divergence, which further supports a bullish outlook for BAL. This risk to reward ratio is too lucrative to pass up on.
This chart based off of The Elliot Wave Theory, Fibonacci, EMA’s, MacD , RSI , Momentum, and resistance/support zones combined with patterns.

BAL | Balancer | Testing final support before bigger dropBAL | Balancer | Testing final support before bigger drop
Looking shakey after being rejected from the 20 D.EMA and showing a significant bearish divergence
| Bearish Signal
| Rejected from the 20 D.EMA
| Lost local support and rejected
| Watch out for PPI Data Drop
| Lost Trendline support and rejected
| Significant Bearish Divergence
| Lost Trendline support and rejected
| Don't Forget To Hit Follow To Never Miss An Idea |
| Please Support By Giving This Idea a Boost |
