$BANANA – Gift Below $30, Trend Reversal Confirmed
BINANCE:BANANAUSDT under $30 feels like a gift.
Starting to build here, and if price dips back into the purple zone, I’ll keep adding.
Monthly trend is active off the lows—this looks like a clear reversal. If it holds, I expect new highs over the next 5 months.
Not sure if $22 gets retested, but if it does, that’ll be a major area of interest.
Strong coin. Strong setup. Time to act.
BANANAUSDT trade ideas

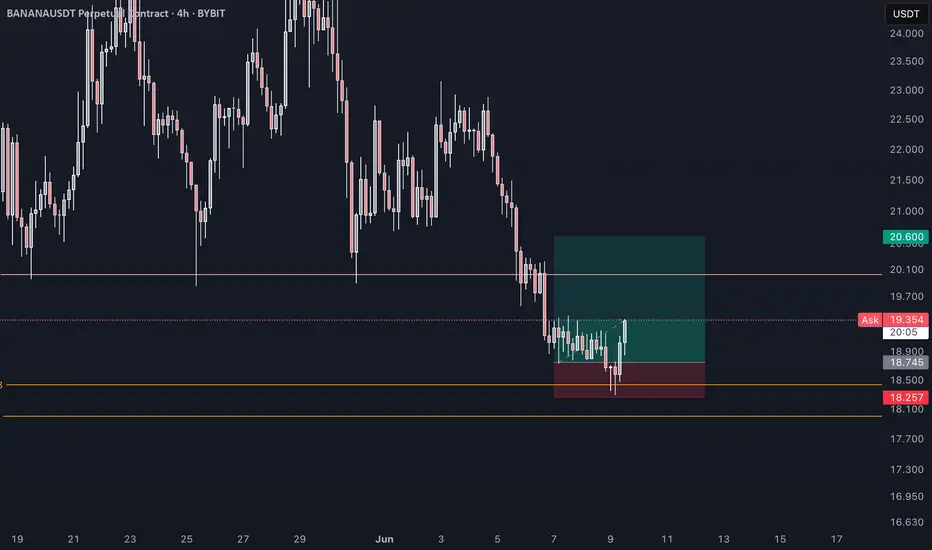
Time to Peel Some Gains — BananaUSDT Ripening at the Midline
📈 Technical Overview:
BananaUSDT is currently testing the midline of the descending channel. A confirmed breakout above this level could trigger a bullish move toward the top of the channel, which aligns with our secondary target. Until the breakout is validated, the price may continue to range within the current structure.
🔸 Watchlist Status:
Setup is not confirmed yet — keep this on your watchlist and wait for a clear breakout above the midline.
📍 Next resistance: Top of the channel
📍 Invalidation: Rejection at midline or breakdown below recent support
📉 Risk Management:
Enter only after confirmation, and risk no more than 1% of your capital. Always define your stop-loss.

$BANANA Near Support, Breakout Loading?$BANANA is moving inside a big symmetrical triangle on the daily chart.
The price is near the support line and starting to bounce.
If it breaks out above the top trendline, we could see a strong move toward $40, which is around 66% upside.
Retweet if you're bullish!
DYOR, NFA

BANANA long "@members been looking at BANANA for a while and posting it as trade idea, could get sniper pf entry I missed it, here I must say Im not sure where Sl should be, however BTC looks interesting and would try some longs here to 0.31
I will be more than happy with just Tp1"
BANANAUSDT Analysis D1BANANAUSDT Descending Trendline Has Already Got Cleared, Banana Can Give Solid Bullish Rally In Coming Days .

Let us deliver the BANANA to the treeHello all,
We will see the BANANA back to the tree.
So let us help it !!!
Enjoy
MIZ

BANANA long directionThere are long direction. It has been breakout the falling wedge. So there is a chance to go UP. Because this coin have great volatility. Possible to get the position partly from current and in red zone.

$BANANA @BananaGunBot 🍌 $BANANA @BananaGunBot 🍌
Wyckoff Accumulation Schematic #1 is my base case.
Time and more data will tell but targeting Secondary test (ST) now.
I have two options where the ST could possibly be.
Clues to Support an Idea:
1️⃣ Prolonged downtrend
2️⃣ Preliminary Support (PS) – Surge in selling volume followed by above-average buying volume
3️⃣ Selling Climax (SC) – Huge increase in selling volume
4️⃣ Automatic Rally (AR) – Short-lived spike in buying volume

BANANA/USDT with a 61.77% potential
BANANA/USDT (6H timeframe)
Current Price: 24.82 USDT
Recent High: 28.19 USDT
Resistance Level Highlighted: 34.28 USDT
Projected Target: Around 34.28 USDT (with a 61.77% potential increase of 13.08 points from current price)
+FVG (Fair Value Gaps):
Two bullish FVG zones are marked, indicating potential areas of interest where price may return for liquidity or support.
Expected Price Movement (Blue Line Path):
A slight retracement is anticipated toward the lower FVG zone (around 20–22 USDT).
After that, a bounce is expected, targeting the major resistance zone around 34.28 USDT.
A heart symbol marks this target area, possibly indicating strong bullish sentiment or a key zone to take profit.
Visual Markers:
Orange box at 34.28: Price target zone.
Vertical purple line: Measures the potential gain (13.08 points or 61.77% rise).

BANANAUSDT – 344% Volume Surge at Key Resistance! “Big volume, big levels—but we don’t FOMO, we wait for confirmation!”
🔥 Key Insights:
✅ 344% Volume Spike – Something is brewing, but is it real?
✅ Major Resistance Zone – This level decides the next big move.
✅ Confirmation is Everything – No breakout? No trade.
💡 The Smart Plan:
Wait for a Clean Break & Retest – No confirmation, no entry.
Watch CDV & Volume Profile – If buyers are serious, we see it here.
LTF Breakout = Green Light – Structure > Hype, always.
“Volume is explosive, but resistance is strong. We wait, confirm, and strike smart!” 🔥
A tiny part of my runners;
🌊 WAVESUSDT.P: Demand Zone Potential
🟣 UNIUSDT.P: Long-Term Trade
🔵 XRPUSDT.P: Entry Zones
🔗 LINKUSDT.P: Follow The River
📈 BTCUSDT.P: Two Key Demand Zones

#BANANAUSDT- Golden Opportunity at Trend Support! Hey there, friends! Today, I’m back with another explosive analysis! 🚀🔥
This time, we’re diving into #BANANAUSDT, one of last week’s hottest topics. We’ve caught it right at a beautiful trend support level. I’ve kept the chart as clean and easy to read as possible.
Now, let’s break it down:
📍 Entry Zone: The $17,300-$17,600 range looks like an ideal buying area since it aligns perfectly with strong trend support.
📍 Stop Loss: Set at $17 for risk management.
📍 Targets: First target sits around $19-$19,500. However, if we see two solid hourly candle closures above $19,500 and confirmation from the $19,150-$19,250 region, then $26 comes into play on our radar.
Wishing you all a trade full of green candles! 📊💰 Let’s discuss in the comments!
Manage your risk, stay in the game! 🎯🔥
#AlyAnaliz #TradeSmart #CryptoVision #BANANAUSDT

$BANANA @BananaGunBot ─ Possibly beginning of Accumulation Range🍌 $BANANA @BananaGunBot 🍌
Could this possibly be the beginning of an Accumulation Range?
As usual, my base case is Wyckoff Accumulation Schematic #1.
Time and more data will tell—adding $BANANA to the watchlist.
Clues to Support an Idea:
1️⃣ Prolonged downtrend
2️⃣ Preliminary Support (PS) – Surge in selling volume followed by above-average buying volume
3️⃣ Selling Climax (SC) – Huge increase in selling volume
4️⃣ Automatic Rally (AR) – Short-lived spike in buying volume

BANANA short setup (4H)BANANA is positioned between an SW H and an SW L. Based on the bases that have formed, it seems that this symbol intends to move toward the targets.
Break even at TP 1.
The closure of a daily candle above the invalidation level will invalidate this analysis.
Do not enter the position without capital management and stop setting
Comment if you have any questions
thank you

What does BANANA look like???Ugh dirty people, it loooks like a parabolic curve!! Wait for the optimised move to remove all your dirty things lAWL

#BANANAUSDT.P - Will the Bullish Flag play out ? After a long break, I have finally regained access to my account.
And after a long break, I’m back with the #BANANAUSDT.P coin!
Looking at the chart, we can see that it's forming a solid Bullish Flag pattern. The ideal entry zone for positions is between $15,500 and $14,900, while the targets are set according to the levels shown on the chart.
In fact, my long-term expectation for #BANANAUSDT is around $30-$35, but let’s first see how this setup plays out before focusing on that. 🚀
Good luck, my friends! 🍀🚀

BANANA CHART ANALYSİS - EDUCATIONAL POSTHow NFT Technology Developed
NFT technology was created in 2017 based on Ethereum smart contracts. Since then, we have witnessed many successful NFT projects and deals. Stories like these perfectly describe the current and future possibilities of the technology.
The development of blockchain technology and the emergence of NFT services coincided with other processes in society and the economy. Many new players appeared in the stock markets, including non-professional traders and amateur investors.
The democratization of financial markets coincided with the pandemic: being in self-isolation, alone with their devices, many people began to pay attention to new financial instruments.
The information that arose around them also played a specific role in the “revival” of NFTs. The big names in the news headlines supporting NFTs couldn’t help but draw attention to them. That is one of the reasons why the success of the technology was inevitable.

#BANANAUSDT maintains bearish momentum📉 Short BYBIT:BANANAUSDT.P from $14.905
🛡 Stop loss $15.490
🕒 1H Timeframe
⚡️ Overview:
➡️ The main POC (Point of Control) is at 16.112, indicating the area with the highest trading volume.
➡️ The 15.490 level acts as a local resistance, as the price previously faced selling pressure there.
➡️ The volume and market profile highlight areas of high trader activity, especially in the 14.250 – 15.500 range.
➡️ The chart shows a potential decline after an impulse move and profit-taking.
🎯 TP Targets:
💎 TP 1: $14.580
💎 TP 2: $14.250
💎 TP 3: $13.920
📢 Monitor key levels before entering the trade!
📢 If 15.490 is broken upward, the trade may be invalidated.
📢 If the price continues to decline and breaks through TP 1, the downside potential remains.
BYBIT:BANANAUSDT.P maintains bearish momentum — expecting further downside movement!

BANANAUSDT(BananaGun) Updated till 11-03-25BANANAUSDT(BananaGun) Daily timeframe range. we can see a retrace here but need more push to actually get over 19.82. getting over 19.82 is more optimal here below that is a trouble zone. PA found a support at 10.82 breaking below is void zone.


BANANAUSDT ... GET READY FOR A SHORTi am looking to short banana the setup is attached..
The 50% area is the target 1
Lets do it guys..

4.7 RR SwingBanana may have already found its low, so this is a lower probability trade in terms of getting filled. However, if it does get filled it should be pretty good.

$BANANA - Looks zone ready to me BINANCE:BANANAUSDT - Has had substantial pullback over the days and it looks plum now to flash back on top. We should see it going higher from here now. All the best!

Trading opportunity for BANANAUSDTBased on technical factors there is a Buy position in :
📊 BANANAUSDT
🔵 Buy Now
🪫Stop loss 49.40
🔋Target 1 72.00
🔋Target 2 85.00
🔋Target 3 99.00
💸RISK : 1%
We hope it is profitable for you ❤️
Please support our activity with your likes👍 and comments📝
