BAND/USDTThe chart clearly shows the support and resistance levels and most important this project is a gem with a limited supply and almost 75% of all already staked .
BANDUSDT trade ideas


BANDUSDT Long SignalBANDUSDT is a Spot Gem and its currently making up the bullish momentum to go further ahead of its current market price, i am highly bullish on $BAND and it will surely spike within the next few weeks. Lets ride this spot beast!
My setup is as follows:
ENTRY: 1.08 - 1.20
One time Entry: 1.13
TARGETS
Short Term: 1.27 - 1.32 - 1.38 - 1.46 - 1.58 - 1.75
Mid Term: 2.00 - 2.40 - 2.90 - 3.50 - 4.20- 5.00
STOP LOSS: 0.87
Please be aware with your money!


Bullish idea BANDUSDT Best Buy Settup Here is the Analysis of BANDUSDT in 1D T.F Price Sweep the Liquadity the Equal Highs and bounce current support zone + spoted Bullish Divergence and priice facing FVG+ Fibb Golden Values + 50 EMA

BANDUSDT needs to flip the resistanceThe price is testing a dynamic support at 1.123$ area above the weekly support at 1.05$
The price needs to grab new liquidity in order to have a new bullish impulse and retest the 1.3$ area.
How to approach it?
IF the price is going to have a clear breakout from the 1.2$ area, According to Plancton's strategy , we can set a nice order
–––––
Keep in mind.
🟣 Purple structure -> Monthly structure.
🔴 Red structure -> Weekly structure.
🔵 Blue structure -> Daily structure.
🟡 Yellow structure -> 4h structure.
–––––
Follow the Shrimp 🦐

Trading opportunity for long position BANDUSDTBased on technical factors there is a Long position in :
📊 BANDUSDT
🔵 Long Now 1.179
🧯 Stop loss 0.925
🏹 Target 1 1.530
🏹 Target 2 1.920
🏹 Target 3 2.689
💸Capital : 1%
We hope it is profitable for you ❤️
Please support our activity with your likes👍 and comments📝

BAND/USDTBAND/USDT
It is in a descending channel.
An upward divergence can be seen in the demand area.
It is not far off to expect the price to increase to $3.5.
#BANDUSDT #BAND #BTCUSDT #BTC #ETHUSDT #DOGE #DOGEUSDT

BANDUSDT Bouncing From The Major Support Zone.BANDUSDT Technical Analysis Update.
BAND price multiple times touches it's support zone, now reversing from the support zone.
Buy zone : $1.26 - $1.285
Stop loss : $1.149
TP 1 : $1.39
TP 2 : $1.510
TP 3 : $1.64
Always keep stop loss
Thanks
Hexa


🟩BANDUSDT Long SetupBANDUSDT
lONG
1.246-1.273
targets
1.315
1.355
1.42
SL
1.207
Share your opinion in the comments and support the idea with Like.
Follow me on tradingView, if you don't want to miss my next analysis or signals.
Thanks for your support!

short trem#Requested_Analysis Band time 1h The last support point is characterized by yellow color. If this support is touched, it should be corrected and adjusted accordingly. If the support of the ranges is used and after seeing the appropriate trigger to get TB

BAND BIG PUMP IN 30M ChartBand is making support at 1.27 level and getting resistance at 1.395 level. After breaking this resistance it will go big. First, it will test the 1.55-1.61 level. Then after breaking that it will soar to 1.90 level fast. Buy some here and hold.
!! Buy and Sell targets is in the chart !!

Dont ask questions GET IN!Long then short then long. Dont ask any questions just take the red pill and hop in!

$BANDlots of coins have dropped to their HTF support
good to add long term imo
this time it does attempt 1.86 it should blast through
loosing 1.273 is invalidation and most likely capitulation wick incoming
Everything depends on Dixie and imo we pullback and then resume for final
blow off top

BAND/USDT - Market Update 20.08.22Hello Traders!
The price of BAND continues to move in a downward trend, testing the support level of $1.30. On the weekly timeframe, the price remains under the MA100 and under the resistance at $3.11 and $5.63, which indicates the continuation of price formation in the downward direction. Considering medium-term positions would be interesting in the case of a drop.
The range for accumulation will be a zone of $0.56-0.77.
The targets are the price levels of $3.11 and $5.63
Good luck and watch out for the market
P.S. This is an educational analysis that shall not be considered financial advice


BANDI think the bulls are creating a trap. The downside is very bad in the current situation, but the charts look good. I think the bulls are looking to liquidate. The bulls are waiting for short orders to swallow them to their advantage. They are afraid, on the other hand, the market will have to settle the long contracts in the next two weeks. In this situation, the bears will start to shorten at the same time as the settlement, but the bulls are much richer than the bears. The result is that the bulls will keep the price in the middle range during the settlement of the contracts. It pulls the price down. Bears who see favorable conditions come in. This is where our rich grandfather liquidates contracts in his favor. This scenario could push Bitcoin above 30,000.

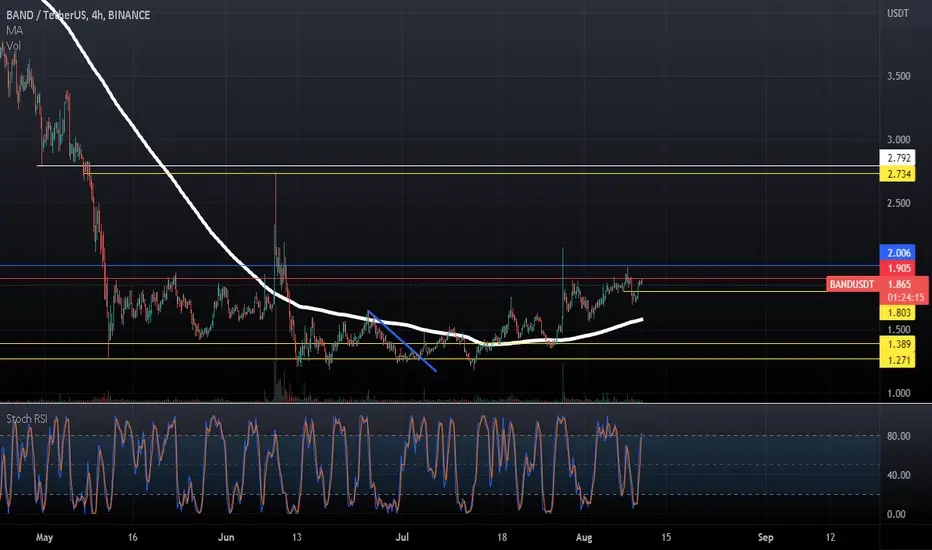
$BAND - updateat resistance flip this red line and we should go to $2.7 quick .
hourly stoch about to turn but H4 is Iffy..
BAND/USDTBAND/USDT
It is in a bearish channel that has reacted to the $1.1 support and the bottom of the channel.
It is expected that we will have a price increase of 3.5 dollars.
#BANDUSDT #BAND #BTCUSDT #BTC #ETHUSDT #DOGE #DOGEUSDT

why not ....!!!nice position return ratio is great and could be happen soon
same as always don’t forget SL
