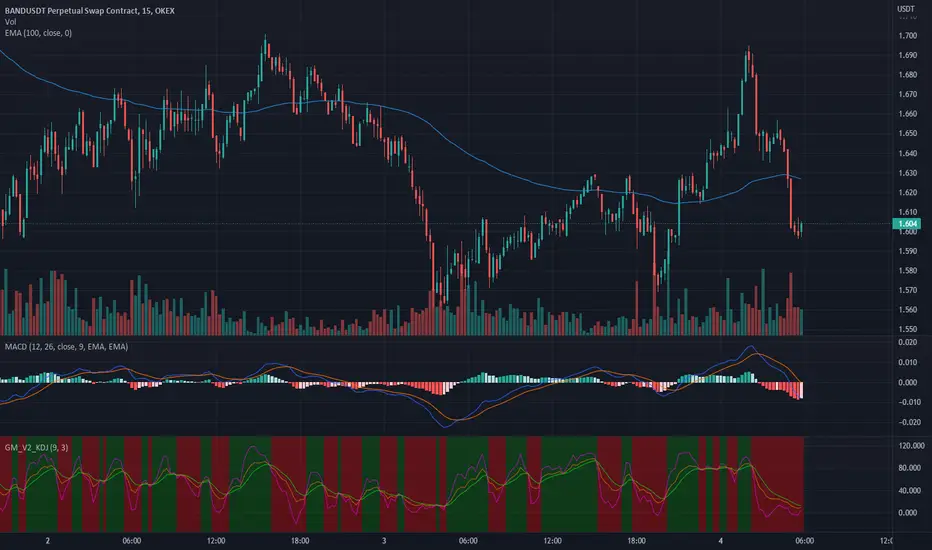
BANDUSDT 4H TA: support and resistanceAccording to the chart, BANDUSDT 4-hour timeframe is in the Rising Wedge pattern, with support levels of $ 1.56 and $ 1.43 and resistance ranges of $ 1.84 to $ 1.91.
Its not Buy or Sell SIGNAL
DYOR
BY : Mohamad Teriz - @AtonicShark
BANDUSDT trade ideas


BandHello dear traders
According to the Momentum Market Band, it does not have the ability to move fast, so in the long run, with risk management at 1.05 to 1.10, they are good points to enter.
Please write your comments to get a good view.
Good luck

BandusdtI am bearish on Band .Band is moving in a decending channel and BTC is not stable at the moment.I am expecting the price to hit low levels as i have marked in the chart unless the channel breaks.

Bandusdt Trading ideasHi friends,
Band correction is over with the structure painting XYZ correction. The first leg WY formed serious Bullish continuation pattern CUP&Handle but unfortunately failed to break important resistance which lead to leg YZ.
Currently spotted potential ADAM and EVE and considering the current general market sentiment, I see this breaking.
Follow the buy advice and always remember your stop loss.

BANDUSDT - 1h Fast Long Signal💡💡#SIGNAL💡💡
BAND / USDT
▶️ BUY NOW + Block
🔴 SLT - 1h (Trigger)
#BANDUSDT_1h_190522


BAND READY TO MOVE UP? LOOKING BULLISH!#BAND possible move in the making, but has to close RSI above 50 for upward move on 1hr otherwise it will retest.

🔥 BAND Channel ContinuationSince bottoming late January, BAND has been trading inside a bullish channel pattern.
A couple of days ago we saw another re-test of the pattern's support, which caused a bounce. I'm looking for further upside for BAND, assuming that BTC will not start selling-off significantly.
Target is the top of the channel.
Happy trading!

BANDUSDT 1D TA: Break TrendLineAccording to the chart in the daily time frame, the trend line is broken upwards and has reacted positively on the important support range. Currently, by reacting again on the ranges, we have the possibility of climbing to the resistance points specified in the chart, and otherwise, with further correction, we will have the possibility of falling to $ 3.1 and $ 2.5.
Its not Buy or Sell SIGNAL
DYOR
BY : Mohamad Teriz - @AtonicShark

bandusdt break the trendlineHi guys , band break the ascending triangle and now ready to go up , target obvious on the chart !

BANDUSDTPERPHello friends, today you can review the technical analysis idea on a 1D linear scale chart for
BANDUSDTPERP
TARGET
6
LEVERGE 4X
STOPLOSS
3.40
BUY
3.40____3.80

multitype dynamic multi registry with categories 3d matrix
using matrixes, and overloads.. a complete parallel multiregistry, multitype,multikey datastore.
it can use get, set, delete, with as many registries and individual matrixes as the system can handle.
system >
registry
category names
key names for each item
value (( to x/y in value matrix)
value matrix
item in x/y coords
so putting item 'float XXX' with a value of XXX (ohlc..) for category 'ohlc values' into value matrix floats, floats1 for hist... etc.. historical value for the past X num of bars for all 4 values in historical matrixes..
here's an example..
almost done testing..
very powerful tool
anyone with extensive skills who can take a look at it, i'm open for help prepping and finding any optimizations available
as is, it is very very fast..
i believe i can improve though from here.
_ohlcreg = initkeyregistry(2,2)
_regfloats = ini_float(2,2)
_hist1_floats = ini_float(2,2)
_colorreg = ini_color(2,2)
set(_regfloats , _ohlcreg, 'Normal', 'open ' , open )
set(_regfloats , _ohlcreg, 'Normal', 'high ' , high )
set(_regfloats , _ohlcreg, 'Normal', 'low ' , low )
set(_regfloats , _ohlcreg, 'Normal', 'close ' , close )
set(_regfloats , _ohlcreg, 'MTF' , 'open ' , request.security('MSFT', 'D', open ))
set(_regfloats , _ohlcreg, 'MTF' , 'high ' , request.security('MSFT', 'D', high ))
set(_regfloats , _ohlcreg, 'MTF' , 'low ' , request.security('MSFT', 'D', low ))
set(_regfloats , _ohlcreg, 'MTF' , 'close ' , request.security('MSFT', 'D', close ))
set(_hist1_floats, _ohlcreg, 'Normal', 'open ' , open )
set(_hist1_floats, _ohlcreg, 'Normal', 'high ' , high )
set(_hist1_floats, _ohlcreg, 'Normal', 'low ' , low )
set(_hist1_floats, _ohlcreg, 'Normal', 'close ' , close )
set(_hist1_floats, _ohlcreg, 'MTF' , 'open ' , request.security('MSFT', 'D', open ))
set(_hist1_floats, _ohlcreg, 'MTF' , 'high ' , request.security('MSFT', 'D', high ))
set(_hist1_floats, _ohlcreg, 'MTF' , 'low ' , request.security('MSFT', 'D', low ))
set(_hist1_floats, _ohlcreg, 'MTF' , 'close ' , request.security('MSFT', 'D', close ))
// add colors for these specific ones.. if a value is attempted to retrieve
// but the spot on the value matrix is empty, it will siimple pull a typecast na.
// so these colors show when specidfied.. will have to make a global or a '*' for any'
set(_colorreg , _ohlcreg, 'Normal', 'open ' , color.red )
set(_colorreg , _ohlcreg, 'Normal', 'high ' , color.green )
set(_colorreg , _ohlcreg, 'Normal', 'low ' , color.blue )
set(_colorreg , _ohlcreg, 'Normal', 'close ' , color.orange)
// ... etc..
// the retrieval now can select along any axis...
// which matrix to use
valmatrix = switch input(0)
0 => _regfloats
1 => _hist1_floats
/// which group to pull from
_barchoice = input.string('MTF', options = )
/// which value from that group-.
valuechoice = switch input(1)
1 => 'open '
2 => 'high '
3 => 'low '
4 => 'close '
plot(get(valmatrix, _ohlcreg, _barchoice, valuechoice ))
plot(get(_regfloats , _ohlcreg, 'Normal', 'open '), 'Normal open ' ,
get(_colorreg , _ohlcreg, 'Normal', 'open '))
plot(get(_regfloats , _ohlcreg, 'Normal', 'high '), 'Normal high ' ,
get(_colorreg , _ohlcreg, 'Normal', 'high '))
plot(get(_regfloats , _ohlcreg, 'Normal', 'low '), 'Normal low ' ,
get(_colorreg , _ohlcreg, 'Normal', 'low '))
plot(get(_regfloats , _ohlcreg, 'Normal', 'close '), 'Normal close ' ,
get(_colorreg , _ohlcreg, 'Normal', 'close '))

#BAND #Bitcoin #LQR #TOBTC The #price can first reach the area of 4.349 for re-testing
Support points are marked on the chart


BANDUSDTLong BANDUSDT
Entry Range 4.8$-4.9$
TP1 5.17
TP2 5.4
TP3 5.62
Sl 4.63
Use proper Risk management
Good luck Friends


BAND/USDT : Rebound above the broken lineBINANCE:BANDUSDT
Hello everyone 😃
Before we start to discuss, I would be glad if you share your opinion on this post's comment section and hit the like button if you enjoyed it !
$BAND has rebounded above the broken trendline and now it's holding the support below.
There're two setups to trade with :
- Positional Traders can have a bag of it and set their invalidation as three candles close below the trendline; Which will confirm the rejection below the trendline.
- Swing Traders can enter above the trendline or set their entry near to $4.9; Stop-Loss should be located below $4.6, Which is crossing the last wicks on the poor lows.
Hope you enjoyed the content I created, You can support us with your likes and comments !
Attention: this isn't financial advice we are just trying to help people on their own vision.
Have a good day!
@Helical_Trades

BANDUSDT DOUBLE BOTTOM pattern breakout.A Bullish pattern double bottom on 1D TF has given a breakout can hold BANDUSDT till given targets.

BANDUSDT - Falling Wedge PatternBANDUSDT (1D Chart) Technical analysis
BANDUSDT (1D Chart) Currently trading at $5.5
Buy level: Above $5.5
Stop loss: Below $3.2
Target 1: $7
Target 2: $10
Target 3: $15
Target 4: $23
Max Leverage 2x / Spot market
Always keep Stop loss
Follow Our Tradingview Account for More Technical Analysis Updates, | Like, Share and Comment Your thoughts

BANDband
bottom of the channel is its own ascent
The canal floor and the white support area (demand area) form a good PRZ
The downtrend line of RSI is also broken, which indicates a rise in price.
