BANDUSDT 1DKeep an eye on the #BAND daily chart. It has formed a falling wedge and can pump at any time. In case of a breakout, the targets are:
$1.351
$1.638
$1.871
$2.101
BANDUSDT trade ideas

$BAND - Roadmap 2024NASDAQ:BAND Roadmap for the rest of this year before completed the Wave C.
Now, BAND is on th Wave C (correction mode) and of this correction has probably started and we can expect it expands to 2025 and probably around $0.3, we can look for new low risk buy setups in Weekly time Frame.

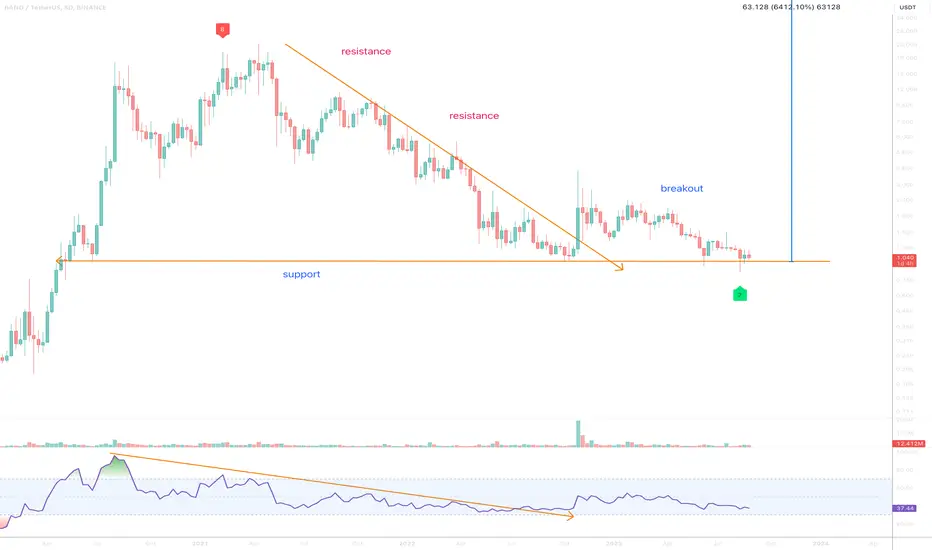
Band Protocol (BAND) - Bullish divergence** Trading opportunity **
On the above 8-day chart price action has corrected 95% since April 2021. A number of reasons now exist to be long, including:
1) Price action and RSI resistance breakouts.
2) Regular bullish divergence. Seven Oscillators print positive divergence with price action over the last 3 to 4 months.
3) Support and resistance, price is on strong historical support, look left.
Is it possible price action continues to correct? Yes.
Is it probable? No.
Ww
Type: trade
Risk: <= 6%
Timeframe: Act now
Return: 50x
Band#BAND
Getting some momentum on the support of falling Wedge in 1D.
Bounce expecting breakout with a bullish wave towards $2.5 in midterm !!!

BAND Key LevelsBand Key Levels Band Key Levels Band Key Levels Band Key Levels Band Key Levels Band Key Levels Band Key Levels Band Key Levels

Opportunity to buy in BANDWe have a bullish iCH on the chart and the trigger line has also broken out.
On the demand range, we can look for buy/long positions
The targets are clear on the chart.
Closing a candle below the invalidation level will violate the analysis
Note that the financial market is risky, so:
Do not enter any position without confirmation and trigger.
Do not enter a position without setting a stop.
Do not enter a position without capital management.
When we reach the first TP, save some profit and try to move the stop continuously in the direction of your profit.
If you have any comments please post them, comments will help us improve our performance
Thanks

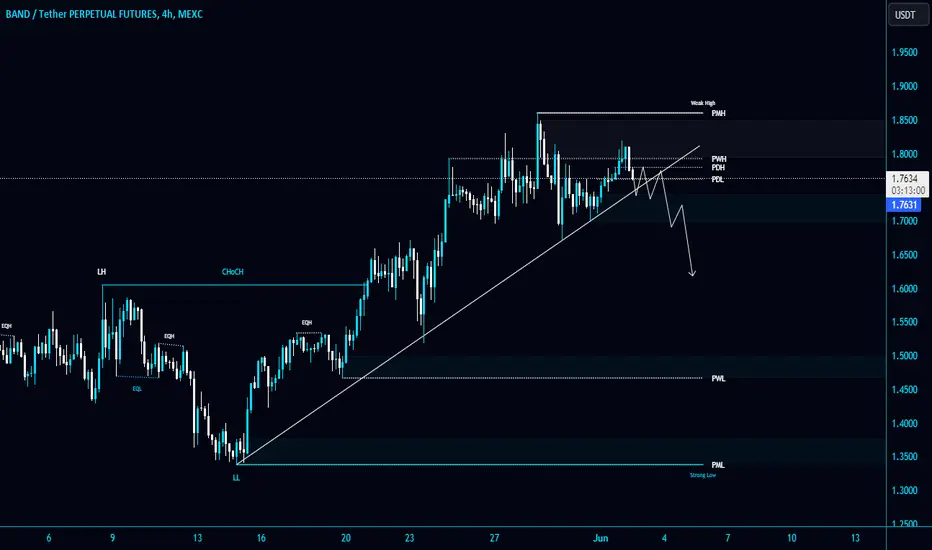
#BAND/USDT looks heavy in 4-Hour TF!#BAND/USDT looks heavy in 4-Hour TF!
NASDAQ:BAND unable to reclaim the PWH $1.794 as a support. Wait for the trendline breakdown or retest to short it.
bandusdtWe are completing wave e from a triangle of a higher degree than the type of contraction triangle. The price is expected to move up to the range of 78% and 125% of the largest leg, as long as the price is above 0.70, the analysis is valid.

BAND/USDT Poised for Bullish Breakout From Falling Trendline👀🚀💎Paradisers, it's time to focus on a stellar trading opportunity with #BAND. As the price tightens between a falling trendline and a solid support at $1.339, we are on the brink of a potential breakout. Maintaining momentum at this level could catapult #Bandprotocol past the falling trendline.
💎However, if NASDAQ:BAND falters and drops below the crucial support at $1.339, it may signal a downward spiral, directing us toward the next essential demand zone at $1.24. This zone has repeatedly catalyzed significant upward rallies due to its substantial liquidity.
💎If #BAND revisits this demand zone, it’s imperative to achieve a strong bounce to preserve support. Failure to do so could amplify bearish forces, deteriorate investor confidence, and potentially trigger further price drops.
💎Keep your strategies flexible and your senses keen, Paradisers. Your ParadiseTeam is vigilantly monitoring the market, ready to guide you through the dynamic shifts of the #Bandprotocol market.
MyCryptoParadise
iFeel the success

#BAND\USDT#BAND
'The price is moving in a downward trend on a 1-hour frame.
The price is moving within it and adhering to it to a large extent,
and it has just been breached. We have a tendency to stabilize above Moving Average 100.
We have a downtrend on the RSI indicator that supports the rise and has been broken to the upside
Entry price is 1.45
The first goal is 1.64
Second goal 1.88
Third goal 2.13

$BAND looks bullish #band chart has a strong structure for mid and short term movements. Price very well accumulated and triple bottomed in time and bullish continuation is expected after the descending channel. Not financial advice.

BANDUSD 1WBAND ~ 1W
NASDAQ:BAND Make purchases gradually on this support block. with a minimum target of 15%+. So far this support has been able to hold the price of $BAND.

BANDUSDT 12HWe have a descending channel on the #BAND 12H time frame chart. #BAND is moving above the MA50, which is a good sign. Currently, it is facing MA100 and the channel resistance. In case of a breakout, the targets are:
$1.859
$2.048
$2.238
$2.508
$2.852

BAND - short-term analysisHi traders,
BANDUSDT on 1D time frame looks very good.
Triple bottom playing out and more bullish price action is expected in the next days and weeks.
This year it's not 'sell in May and go away' for altcoins but more like 'BUY IN MAY'.
Target: 2,49 $
If you're very bullish on BANDUST, you can target 2,80$
Each fib level shown on the chart may act as a resistance so don't forget to take profit on the way up.
Good luck

BAND/USDT Possible to bounce on here and break the descending!💎 Paradisers, #BAND is indeed a coin worth monitoring closely.
💎 It's currently situated at a key support area, and a successful bounce from this level is crucial to maintain bullish momentum and continue its upward movement.
💎 If the bounce proves to be valid, BAND may attempt to break above the resistance trendline of the descending pattern.
💎 However, if BAND fails to break above the resistance and experiences rejection, there's a potential for the price to retreat back to the support area. Repeated touches on the support may gradually weaken its effectiveness, posing a concern for the bullish outlook.
💎 The bullish invalidation would occur if BAND fails to bounce from the demand area and confirms a daily candle close below the support level at 1.25. This would indicate a shift towards bearish sentiment and could lead to further downward movement in price.
MyCryptoParadise
iFeel the success🌴

BANDUSDT LONG PhemexBAND The Forgotten 200% From 2022. I Charted this one time and it Ran from $0.10 to $18. this is the second time im charting this Currency. 2.222 is resistance IMO it smashes it.UP 4 Targets.

BANDUSDT 6H#BAND is moving above the support. If it keeps the support, it can reclaim the trend line. In this case, targets are:
$1.624
$1.859
$2.048
Main support: $1.382

BANDUSDT BOMB soonBANDUSDT BOMB soon 1h
BANDUSDT BOMB soon 1h
BANDUSDT BOMB soon 1h
BANDUSDT BOMB soon 1h
BANDUSDT BOMB soon 1h

BANDUSDT ready for a strong moveThis crypto has been bullish on the higher timeframe but recently we saw it retrace. However, on the 1H timeframe, a breakout of the triangle has occured and if price manages to keep doing higher highs and higher lows then my targets will be 2.25 and 2.50.

BANDUSDT - Triangle Breakout and Heading towards next ResistanceBINANCE:BANDUSDT (4H CHART) Technical Analysis Update
BANDUSDT is currently trading at 1.80 $ and and successfully breakout from the triangle pattern, its heading towards the next resistance around 2.0
We can expect the trend to continue and out final target is around 2.3
Long Entry level: $ 1.8
Stop loss: below $ 1.621
Target 1: $ 1.9
Target 2: $ 2.0
Target 3: $ 2.1
Target 4: $ 2.3
Max Leverage: 2x
Don't forget to keep stop loss.
Follow Our TradingView Account for More Technical Analysis Updates, | Like, Share and Comment Your thoughts.
Cheers
GreenCrypto

BAND will pump soonBefore anything else, you should note that the time frame is large and time-consuming (it is 2D).
BAND seems to be consolidating a triangle pattern, we are now in wave D of this triangle.
Wave D is a diamond diametric, which now seems to be in the bullish wave E of this diametric.
The target indicated on the chart (2.723) is expected to be hit in the coming days
Closing a daily candle below the green range will violate the analysis
For risk management, please don't forget stop loss and capital management
Comment if you have any questions
Thank You

BANDUSD 1WBAND ~ 1W 📈
#BAND It is only a matter of time until NASDAQ:BAND Successfully breaks this Resistance Line, and the Bulls will start to dominate. Buy in stages here, with a minimum target of 20%++

BANDUSDT 3DBuy a bag of #BAND and hold. It is trying to break the range. 400% (4x) Rally is coming. Targets are:
$2.967
$4.279
$5.340
$6.400
$7.910
$9.833
